
The Altinity SQL Browser: Powerful, Lightweight, and Secure
TL;DR: The Altinity SQL Browser is a self-contained ClickHouse® SQL workbench with no backend service. It ships as one HTML file plus config, uses OAuth with ClickHouse RBAC instead of a shared service account, and adds dependency and EXPLAIN graphs, version-controlled query libraries, multi-statement scripts, and direct-to-disk exports.
Most database consoles are a commitment. You stand up a server, install the console on it, give it a service account with its own set of database credentials, and then spend time you don’t have to spare patching it, scaling it, and hoping nobody finds a way to leak that shared credential. It’s infrastructure you own on top of everything else.
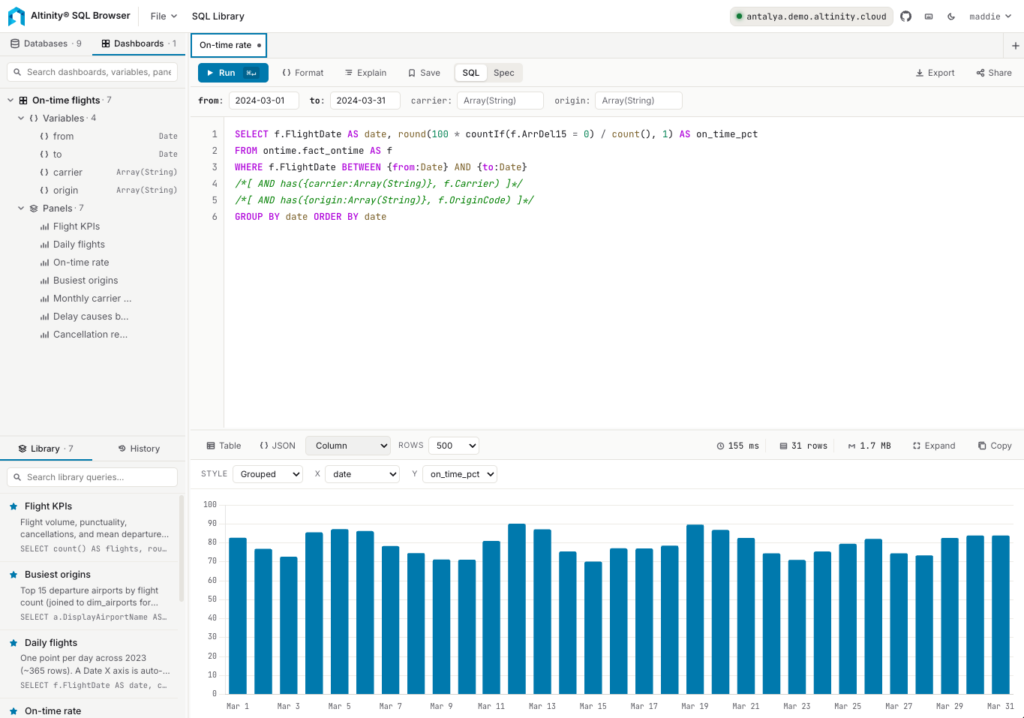
The Altinity SQL Browser changes all that. But before we get to its architecture and features, it’s a great-looking console:
What sets the SQL Browser apart is its architecture. It started from a different premise: what if the console wasn’t a service at all? What if it was just a file?
One HTML File, One Config File, No Backend
The SQL Browser is a self-contained, OAuth-gated SQL workbench for any ClickHouse cluster, and the whole thing ships as a single HTML file with a JSON config file. You don’t need an application server sitting between you and ClickHouse. To deploy it, simply upload two files into the user_files directory and set up an HTTP handler; now you have a sophisticated ClickHouse query UI.
That changes the story completely. There’s no patching, no scaling, no secret rotation, because there’s no service to patch, scale, or hand a secret to. Upgrading means copying a new file over the old one, no restarts required. And because everything (CodeMirror, Chart.js, the graph layout engine, the markdown renderer, graphics for the UI, etc.) gets bundled at build time, there are no external loads of anything at runtime. Here’s the architecture:
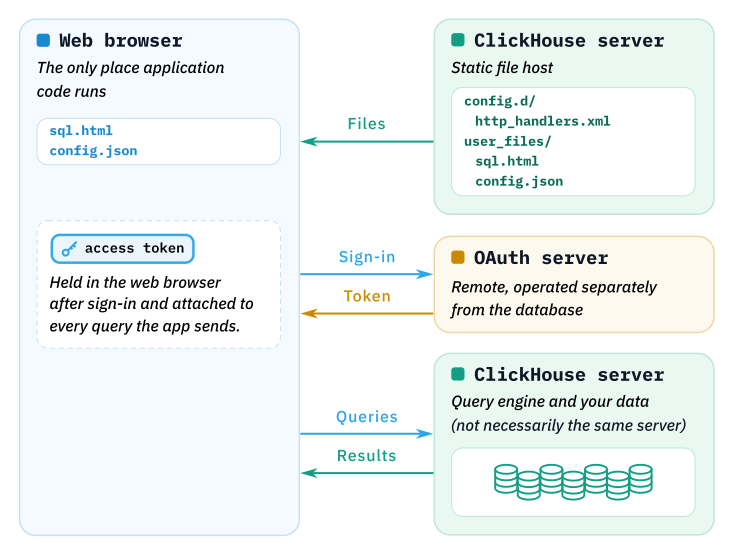
Everything runs in the web browser. It’s a four-step process:
- The web browser loads
sql.htmlfrom the ClickHouse server. That page in turn loadsconfig.json, which has details of identity providers and preset ClickHouse clusters. - The SQL Browser presents a list of saved connections. When the user chooses one, the web browser sends them to the appropriate identity provider.
- After the user authenticates, the identity provider sends an access token back to the web browser.
- From this point on, as the user works with the SQL browser, every query sent to the cluster includes the access token. But that cluster may not be the same one that served the
sql.htmlfile. The ClickHouse cluster at the top of the diagram simply serves up the files to the web browser.
(Note: You can serve sql.html and config.json from anywhere; they don’t have to be stored in ClickHouse. But you’ve got a ClickHouse server already, so…)
The authentication model is what makes this really interesting. Each user signs in through their organization’s identity provider. The app gets the identity provider’s configuration from the config file and manages OAuth tokens for you, sending a bearer token with every query. ClickHouse validates the token and executes the query under the user’s identity, including their roles, grants and profiles. The full power of ClickHouse’s RBAC toolset is at work; all the identity management work you’ve done gets reused automatically. (If you’re not using OAuth, you can also connect to a server with a username and password.)
The app’s structure has a major security benefit: it never holds a credential. There’s no shared service account sitting in a config file somewhere waiting to be compromised, because there’s no service account at all. If your ClickHouse permissions say you can’t touch a table, the database denies your request, just as it would if you’d typed the query in clickhouse-client. And a strict Content-Security-Policy locks down which origins the page can even talk to, so there’s no path for an attacker to reach out from some unknown corner of the web.
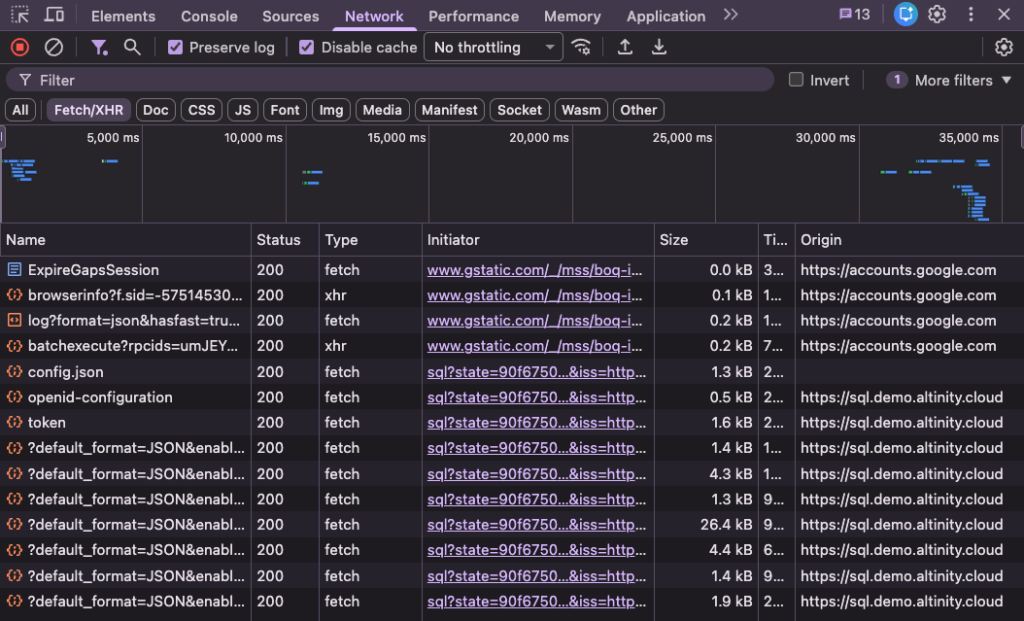
Open the network tab while using it and you’ll see only two origins: your identity provider (Google, in this case) and your chosen ClickHouse cluster:
That’s the SQL Browser’s architecture; now let’s look at a few of its features.
Showing Schema As a Dependency Graph
Many ClickHouse users have had the experience of dropping a table that seemed safe to drop, only to discover later that a materialized view was quietly feeding an aggregate that half the company’s dashboards depend on. ClickHouse is happy to let you build these dependency webs, materialized views, dictionaries, and distributed tables layered on top of each other, but it can be difficult to find those connections.
The SQL Browser’s answer is a data-flow graph you generate just by dragging a database or table into the results pane:
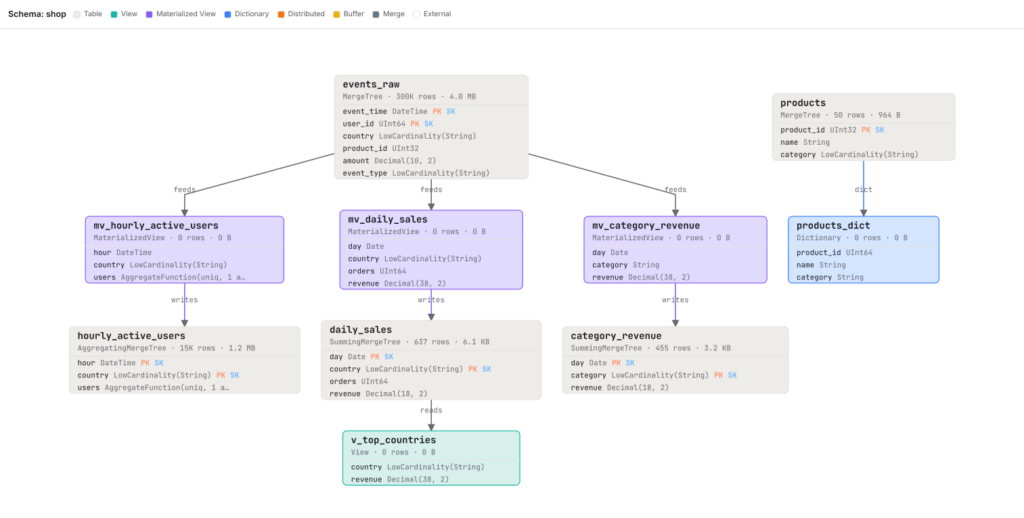
It draws out the full dependency chain: materialized views are shown feeding from their sources and writing to their targets, plain views are shown reading from theirs, and nodes are colored by engine type so you can tell what you’re looking at. There’s also an Expand view that pops the graph out into its own tab with richer cards per node: engine type, row and byte counts, full column lists with key badges, and the complete output of the SHOW CREATE statement.
Reading a Query Plan
ClickHouse’s EXPLAIN PIPELINE tells you exactly which physical processors are reading, transforming, aggregating, and merging your data, which is enormously useful information trapped inside an indented text tree that becomes nearly unreadable past a dozen lines.
EXPLAIN PIPELINE
SELECT
    pickup_location_id,
    fare_amount,
    trip_distance
FROM tripdata.taxi_trips
WHERE (pickup_datetime >= '2023-01-01') AND (pickup_datetime < '2023-12-31')
ORDER BY fare_amount DESC
LIMIT 200
SETTINGS max_threads = 4
Generates these results:
(Expression)
ExpressionTransform
  (Expression)
  ExpressionTransform
    (Expression)
    ExpressionTransform
      (JoinLazyColumnsStep)
      LazyMaterializingTransform 2 → 1
        (Limit)
        Limit
          (Sorting)
          MergingSortedTransform 4 → 1
            MergeSortingTransform × 4
              LimitsCheckingTransform × 4
                PartialSortingTransform × 4
                  (Expression)
                  ExpressionTransform × 4
                    (Expression)
                    ExpressionTransform × 4
                      (Expression)
                      ExpressionTransform × 4
                        (ReadFromMergeTree)
                        MergeTreeSelect(pool: ReadPool, algorithm: Thread) × 4 0 → 1
        (LazilyReadFromMergeTree)
        LazyReadFromMergeTreeSource 0 → 1
The SQL Browser turns that same output into an interactive processor graph with boxes and arrows you can pan, zoom, and blow up to fullscreen. Suddenly the patterns that were invisible in text jump out visually:
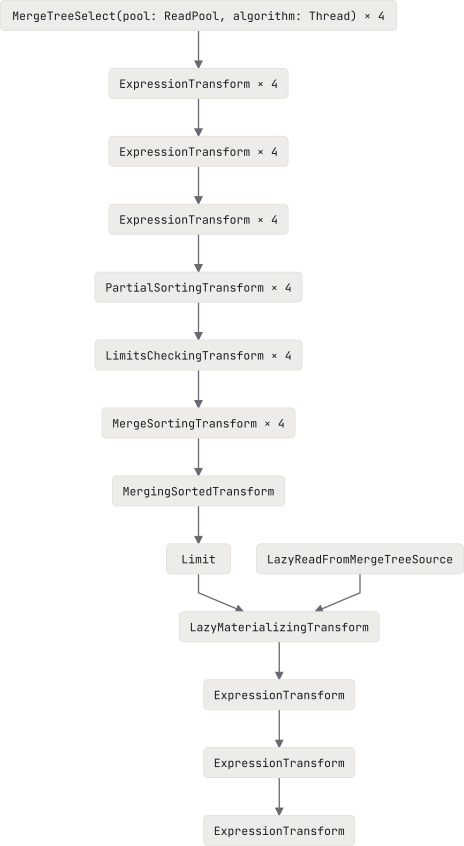
Labels like ExpressionTransform x 4 indicate there are four parallel reading threads. It’s easy to spot where parallel lanes collapse down into fewer streams; that’s typically the first place worth looking at when a query is running slower than it should.
Building a Library of Useful Queries
Every team running ClickHouse accumulates a body of half-remembered queries to find performance bottlenecks, troubleshoot problems, discover dependencies, and other useful things. Those typically end up scattered across chat history, Slack channels, or someone’s personal scratch file, and get reinvented on a regular basis.
The SQL Browser lets you save those queries with a name and description, writing one or more statements into a single JSON file that can be saved, opened, or appended. And it’s just a file, so you can put it in version control: check it into a repository next to the schema it queries, review changes to it in a pull request, and onboard new teammates by pointing them at the file instead of a Slack search. Here’s what an imported library looks like:
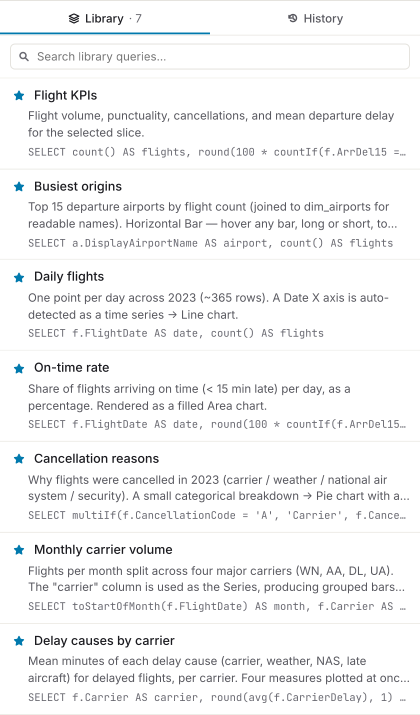
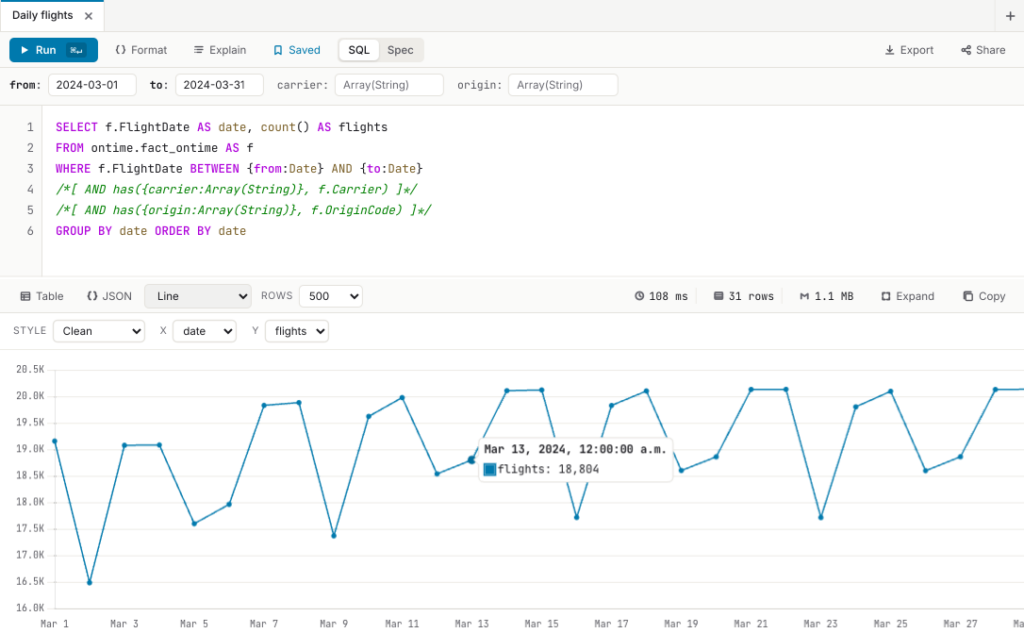
There are seven queries here, each of which has been annotated with a short description. Clicking a library item opens the query in the main window and runs it. For example, here’s the Daily flights query:
The library can also be exported as a markdown document (each query gets a heading, description, and fenced SQL block), and a plain .sql file where each query becomes a comment followed by its statement. You can run that .sql export through clickhouse-client directly, or open it in a tool like DBeaver or DataGrip for step-by-step execution. That means the same library authored once in the browser can serve as a scheduled job’s input, a migration reviewer’s reference, and a teammate’s starting point regardless of what client they prefer.
Run a Whole SQL Script, Statement By Statement
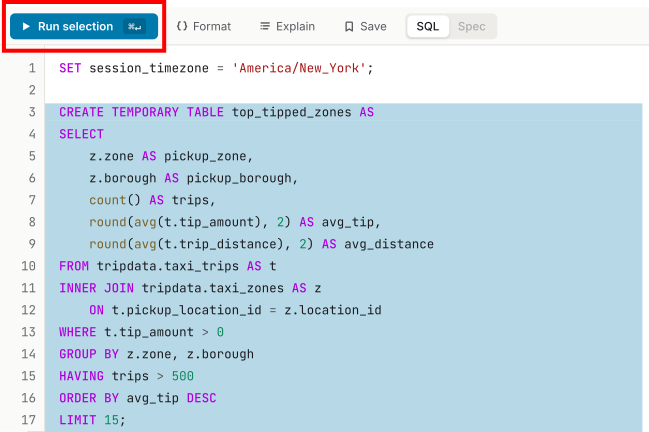
There’s a small but constant annoyance in the world of ClickHouse: the HTTP interface only runs one statement per request, even though clickhouse-client has handled this for years with the --multiquery flag. The SQL Browser handles it too. Paste a semicolon-separated script, click Run, and each statement executes in order as its own request, with a per-statement grid showing what happened.
Here’s an example. We start by setting the session_timezone; that doesn’t do anything useful, but we can verify that it stays in effect throughout the session. Then we create a temporary table that we use in subsequent statements. The result of the fourth statement is a list of the 15 locations with the highest average tip, ordered by the number of trips:
SET session_timezone = 'America/New_York';

CREATE TEMPORARY TABLE top_tipped_zones AS
SELECT
    z.zone AS pickup_zone,
    z.borough AS pickup_borough,
    count() AS trips,
    round(avg(t.tip_amount), 2) AS avg_tip,
    round(avg(t.trip_distance), 2) AS avg_distance
FROM tripdata.taxi_trips AS t
INNER JOIN tripdata.taxi_zones AS z
    ON t.pickup_location_id = z.location_id
WHERE t.tip_amount > 0
GROUP BY z.zone, z.borough
HAVING trips > 500
ORDER BY avg_tip DESC
LIMIT 15;

SELECT * FROM top_tipped_zones;

SELECT
    pickup_zone,
    pickup_borough,
    avg_tip,
    trips,
    now() AS run_at_local_time
FROM top_tipped_zones
ORDER BY trips DESC;
We get a grid showing us the results of all the steps:
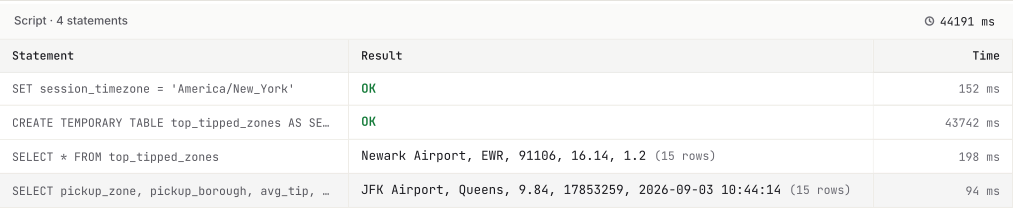
Clicking any of the lines displays the results for that particular statement. Here are the results of the last one:
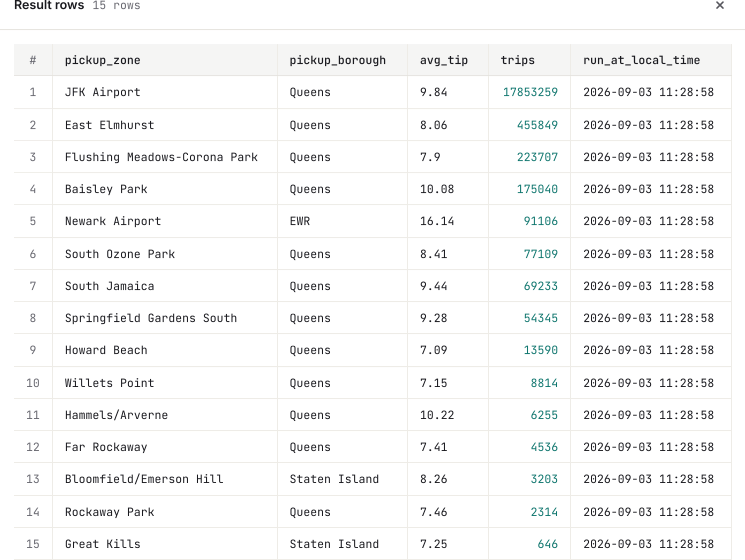
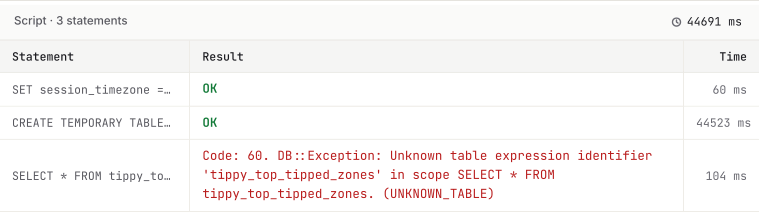
Finally, if a statement fails, the SQL Browser will stop execution at that point and display the error. Here we put a nonexistent table name in step 3:
Exporting Streams Straight to Disk
To stay responsive, most SQL consoles cap how many rows they display. But sometimes you don’t want to look at data, you want to download it as a file and work with it beyond ClickHouse. Asking a browser tab to buffer millions of rows to build a downloadable file isn’t practical.
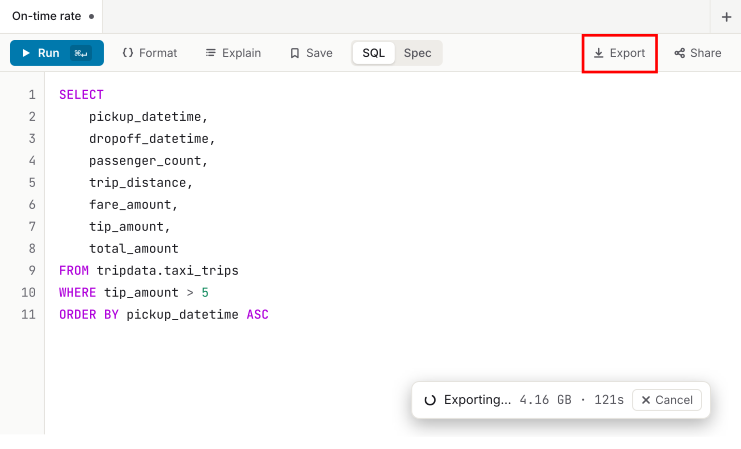
The SQL Browser’s Export feature bypasses the browser window entirely. It streams query results directly to a file on disk using the browser’s File System Access API. That means memory usage stays flat, whether the result is a thousand rows or a billion. The output format is whatever you specify in the query’s FORMAT clause, whether that’s Parquet, CSV, TSV, JSONEachRow, Avro, or others, with the right file extension applied automatically.
Clicking the Export button runs the query and downloads the results, however large they may be, to your machine. In this example, the query has been executed and so far 4.16 GB of TSV data has been downloaded in just over two minutes:
Rolling This Out: Deploy Locally First, Then Go Team-wide When You’re Ready
If you’re not ready to deploy anything to your ClickHouse server yet, there’s a local option: a single curl command installs a lightweight Python launcher (no node, no pip, no build step) that reads your existing ~/.clickhouse-client/config.xml and offers up your saved connections in a login picker, after quietly probing which hosts actually respond.
curl -fsSL https://raw.githubusercontent.com/Altinity/altinity-sql-browser/main/install.sh | shQueries still go straight from your browser to the cluster; the runner only ever hands over the app itself and the list of hosts. When you outgrow that and want a shared, always-on URL that your whole team can hit, it’s the same file, just served by ClickHouse instead of by you.
Summary
The philosophy behind the SQL Browser is simple: wherever possible, let the database do the work it’s already capable of, and avoid introducing new infrastructure, new credentials, or new failure modes just to build a nicer interface on top. It clearly delivers on the promises in our title:
- Powerful – Unravel dependency chains, find performance bottlenecks, run multiple queries in a session, and retrieve large datasets.
- Lightweight – It’s two files. Put them in
user_files, set up the HTTP handler and you’re done. - Secure – Because it’s integrated with your OAuth infrastructure, the security policies you’ve put in place already are automatically enforced.
You can use the SQL Browser directly from the Altinity Demo server. You can also see the SQL Browser’s home page for details on installation, read articles on the browser’s features and design decisions, and check out the project’s source code. (It’s open-source, of course.) Enjoy!
ClickHouse® is a registered trademark of ClickHouse, Inc.; Altinity is not affiliated with or associated with ClickHouse, Inc.