
Using the Altinity Grafana Plugin for ClickHouse® in Grafana Cloud
The Altinity Grafana plugin for ClickHouse makes it easy to use the world’s best open-source observability platform to visualize data from the world’s best open-source analytics database. First released in 2017, the Altinity plugin is mature and the most popular,…


Showing Beautiful ClickHouse® Data with the Altinity Grafana Plugin
The Altinity Grafana Plugin for ClickHouse® is the most popular plugin for creating dashboards on ClickHouse data with over 16M downloads. In this webinar, we’ll reveal how it works and how you can use it to create flexible, attractive dashboards…


Altinity Grafana Plugin for ClickHouse®: Ready for Grafana 10 and Beyond
The Altinity Grafana Plugin for ClickHouse 3.0.0 is fully compatible with Grafana 10. Find out how to get it and see the roadmap. 15M downloads can’t be wrong!
Grafana Integration with ClickHouse® Video Series
Check out the latest video series that teaches anyone with a basic knowledge of Linux or Docker how to connect Grafana to ClickHouse and get right to work. These videos use a public demonstration ClickHouse cluster hosted on Altinity.Cloud, so…

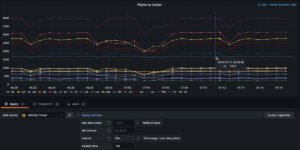
Building Beautiful Interactive Dashboards with Grafana and ClickHouse®
Grafana and ClickHouse are a very popular combination for interactive dashboards on big data. In this presentation, we’ll show you how to install Grafana on ClickHouse, and lead you through the steps to create nice-looking dashboards of your own. The…
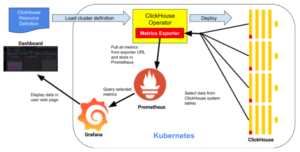
Monitoring ClickHouse® on Kubernetes with Prometheus and Grafana
The ClickHouse Kubernetes operator is great at spinning up data warehouse clusters on Kubernetes. Once they are up, though, how can you see what they are actually doing? It’s time for monitoring!In this article we’ll explore how to configure two…