Using the Altinity Grafana Plugin for ClickHouse® in Grafana Cloud

Note: The author would like to thank Eugene Klimov for his advice and expertise in making this article clearer, especially the data visualization examples towards the end of the article. And for maintaining and dramatically expanding this awesome plugin.
If you love ClickHouse®, Altinity can simplify your experience with our fully managed service in your cloud (BYOC) or our cloud and 24/7 expert support. Learn more.
The Altinity Grafana plugin for ClickHouse makes it easy to use the world’s best open-source observability platform to visualize data from the world’s best open-source analytics database. First released in 2017, the Altinity plugin is mature and the most popular, with more than 16.6 million downloads. It features deep ClickHouse integration, useful macros and macro functions, and the ability to create sophisticated SQL queries, striking the perfect balance of power and ease of use. And for version 3.0.0, the plugin’s UI has undergone a complete rewrite, moving from Angular to React.
Grafana Cloud is much more than Grafana as a service. Yes, it features a wide array of plugins that let you build dashboards and share them with others, but it also provides a number of hosted services beyond Grafana in the cloud. In a future post we’ll look at Grafana Cloud’s hosted Loki and Prometheus services, a great way to add logs and metrics to your dashboards. With the Altinity Cloud Manager’s updated support for Loki and Prometheus, Grafana Cloud extends what you can do to monitor and manage your ClickHouse clusters.
Creating a Grafana Cloud account
Everything we’ll do here uses a free Grafana Cloud account. Obviously a paid account has more capabilities, but the free account will get you started. You can then move to a paid account as your needs grow. Visit grafana.com to create your free account.
A note about self-hosted Grafana: You can, of course, install Grafana on your own machine and work with the Altinity ClickHouse plugin. However, it may be difficult to connect resources inside your Altinity.Cloud ClickHouse clusters to your local machine. And in a follow-up post, we’ll be using Prometheus and Loki services hosted on Grafana Cloud. (In other words, you’ll need a Grafana Cloud account sooner or later, so why not sign up now?)
Adding the Altinity Grafana plugin for ClickHouse
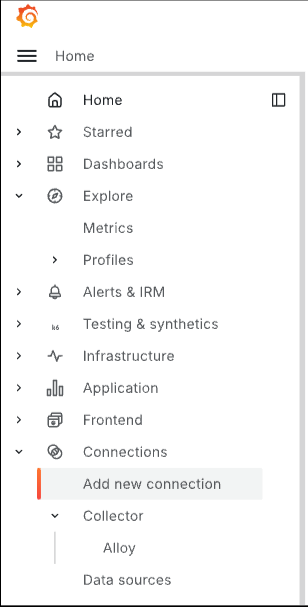
Now log in to your Grafana Cloud account and expand the menu on the left. Expand the Connections tab and select Add new connection:
Type altinity in the search box. You’ll see the tile for the Altinity plugin:

Click on the plugin’s tile to go to the plugin’s overview page. If you haven’t used the Altinity plugin before, you’ll see something like this:

Make sure the version number is 3.1.0 or higher and click Install.
On the other hand, if you have used the Altinity plugin before, you’ll see a different set of buttons:

Make sure the version number is 3.1.0 or higher. If not, click Update to get the latest version of the plugin.
Creating a new data source
Once you’ve got the latest version of the plugin installed, click the Add new data source button. You’ll see this panel:

To work with the examples here, use the following values:
- Name: whatever you like, we used the name
github-demo-cluster-altinityhere - URL:
https://github.demo.altinity.cloud:8443/ - Auth: select Basic auth
- User:
demo - Password:
demo
To create a data source from your own ClickHouse clusters, you’ll need the same information. The URL field should include the protocol and the port number as shown above.
To complete the connection, scroll to the bottom of the page and click the Save & test button. Hopefully you’ll see this:
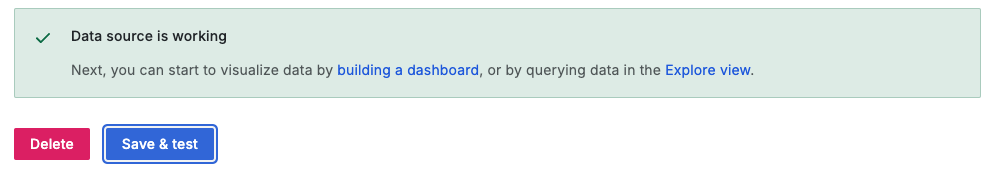
If anything goes wrong, you’ll get an error message:

Exploring the new data source
Once you get the “Data source is working” message, you can click either the building a dashboard link or the Explore view link. We’ll look at the Explore view now. When you create a dashboard, you’ll add a visualization that goes through the same steps we’ll cover here. (More on dashboards later.)
The Explore view starts with an empty query:

The data source you just created is displayed at the top of the panel. Click the Database field to see the list of databases available in your ClickHouse cluster:
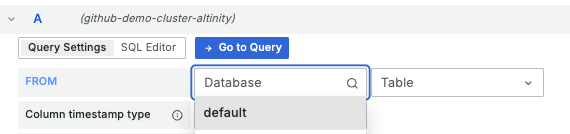
The only database available in this data source is default. (Our credentials don’t let us see other databases.) Select default, then click the Table field to see the list of all the tables in the database you selected:

Select the github_events table. (This data is from the GH Archive project, containing details of more than 7 billion events from public GitHub projects.) Next, select merged_at as your timestamp column:
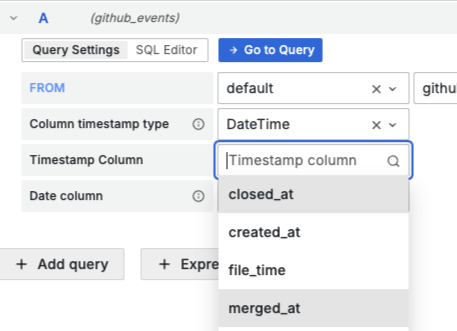
The panel should look like this:
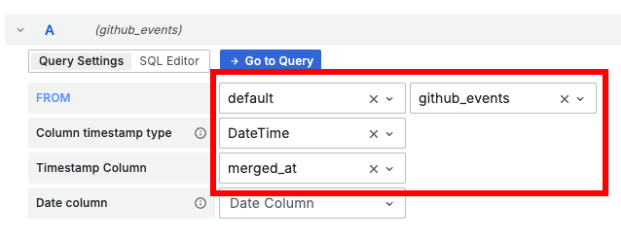
We’re dealing with time series data here, so these choices tell Grafana which database to use, which table to use, and which column in that table is the timestamp.
One of the strengths of the Altinity Grafana plugin for ClickHouse is its focus on letting you create complex queries directly. Click the SQL Editor button:

Now replace the default text with this query:
SELECT
    toStartOfHour(merged_at) AS event_time,
    count(*) AS merged_pr_count
FROM
    $table
WHERE
    $timeFilter
GROUP BY
    event_time
ORDER BY
    event_time
The $table macro inserts the name of the table you selected. $timeFilter sets the range of the query to the time range set in the Grafana panel. (We’ll look at time ranges in a minute.) The query returns the count of PRs merged per hour over the time range currently selected in the Time Picker.
Now click the Run Query button. You’ll see a graph of the data. Click the Stacked Lines button above the graph and you’ll see something like this:

You can change the look of the graph by clicking the Lines, Bars, Points, and other buttons above the graph.
In this example, the time range is set to the last seven days. You can change the time range by clicking on the clock icon above the graph. You’ll see this display:
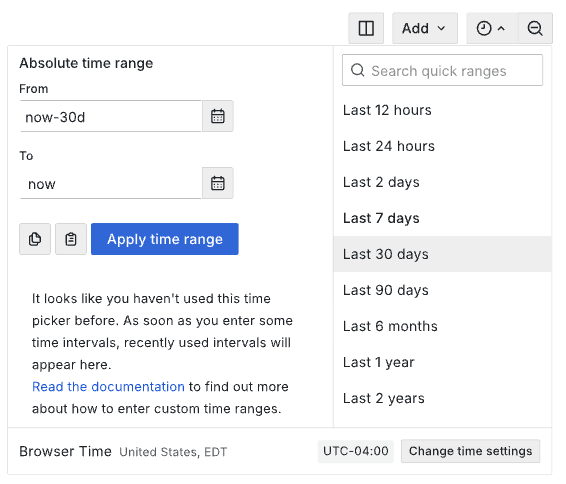
This changes the time range to the last 30 days. Click the Apply time range button and the graph will refresh:

Without the $timeRange macro in our query, we would have to change the query every time the time range changed.
Importing a dashboard
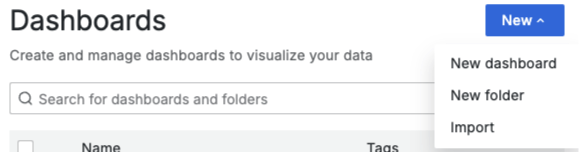
To import a dashboard, go to the Dashboard view, click the New button, then select Import:
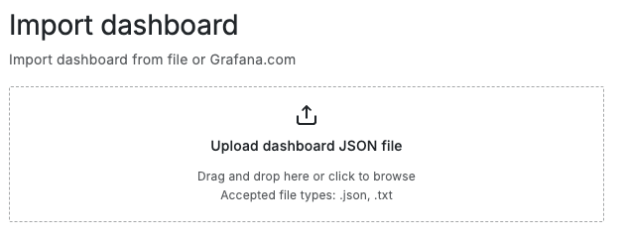
Download the dashboard JSON file and save it to your machine. You need to download the file from GitHub, then upload it to your Grafana Cloud account; you can only download dashboards directly from Grafana. Click the upload link and select the JSON file from your machine.
You can give the dashboard a different name or move it to a different folder, but the most important thing is to connect the correct data source to the dashboard. Select the github-demo-cluster-altinity data source you defined earlier:

Finally, click Import to see the dashboard. The entire dashboard is too large to fit here, but the first few visualizations look like this:

The dashboard has visualizations of on time flight data from the U.S. Bureau of Transportation Statistics. The main dataset is the Airline Service Quality Performance data, which we stored in our ClickHouse cluster as the online table in the default database.
In the dashboard we initially set the date range to show only flights from 2020. (The influence of the COVID pandemic creates interesting patterns in the data.) The upper left is a query of the number of unique airlines in the database (36). Beneath that is the number of flights from all carriers for the selected date range:
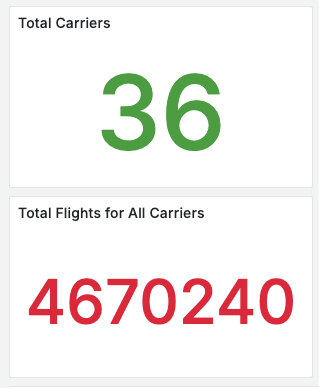
Those queries are straightforward, counting the unique values of the Carrier field and counting all the flights that match our date range.
Another interesting data visualization is to plot late arrival data: what airports have the most late-arriving flights? The dashboard includes a geomap, a visualization that plots tabular data onto a map, given the latitude and longitude of each data point. The ontime table includes the airport code for each destination airport, and we do a join with the airports table to get the map coordinates for each flight.
For each airport, the size of the circle indicates the number of flights to that airport. The color of the circle indicates what percentage of flights to that airport are late. Green means fewer than 10% of flights were late, yellow means above 10% but below 20%, and red means more than 20% of flights were late.

The next visualization is a straightforward time series graph of how many flights each carrier operated on a particular day.

The last thing we’ll look at is a heatmap showing the percentage of canceled flights for each airline in the database. Each row in the heatmap shows the on time performance of an individual airline:
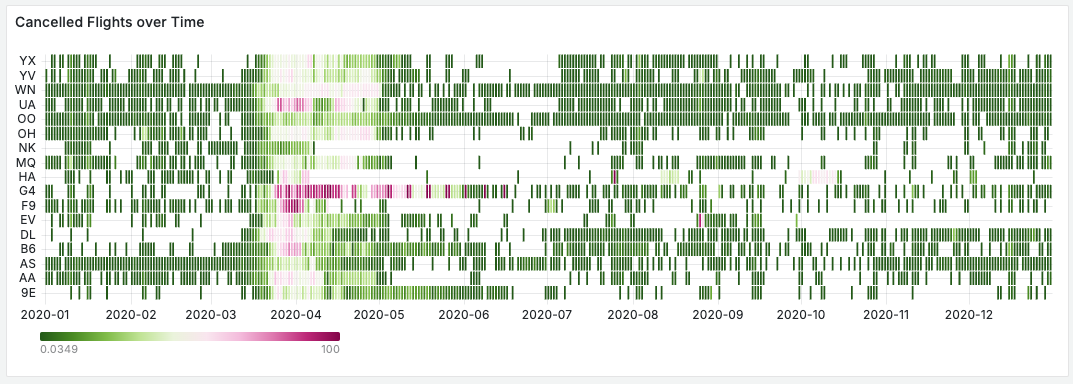
Zooming in on the heatmap, we can see that airline G4 (Allegiant Air) canceled 96% of its flights on March 29, 2020:

These canceled flights happened at the peak of the pandemic, so it’s no surprise that airline performance was dismal. The faded colors throughout the heatmap during the March – April 2020 timeframe makes it easy to spot the trend of cancellations.
This dashboard does a great job of using Grafana Cloud to visualize different aspects of a large ClickHouse dataset.
Unique features of the Altinity Grafana plugin for ClickHouse
We’ve taken a good look at some of the ways you can visualize data in your ClickHouse clusters. The Altinity plugin is a great tool for delivering data to the wide range of Grafana visualization plugins, but its design and macro features separate it from other database plugins.
The plugin focuses on power and flexibility, making the SQL Editor a crucial part of every visualization. You select the database, table, time series field, a date column if you need it, then you go to the SQL Editor. From there, you get a number of macros and macro functions that make it easy to create complex queries to drive your visualizations. And, of course, you also have the ability to use the full power of SQL.
We’ve looked at macros like $table and $timeFilter already, but there are many more macros and macro functions. As a quick example, the $columns macro function makes it easy to visualize data for a particular column. Let’s say we want to graph the number of flights per carrier during a given date range. This query does the trick:
$columns(Carrier, count() Flights) from $table
It’s as simple as that, and it generates this visualization:

There are more than two dozen macros and macro functions that make it simple to create complex views of data. The plugin’s README has complete details on the macros and macro functions.
Summary
The Altinity Grafana plugin for ClickHouse is an extremely powerful, capable, and flexible way to visualize your ClickHouse data. The plugin is easy to install and configure, and you can use it to create many different visualizations of your data, including bar charts, column charts, gauges, geomaps, heatmaps, flame graphs, and even pie charts. Combined with a Grafana Cloud account, you have a world-class open-source observability platform that’s a great companion to the world-class open-source analytics features of ClickHouse.
Learn more
For a high-level overview of the plugin, see Altinity CEO Robert Hodges’s recent blog post, Altinity Grafana Plugin for ClickHouse: Ready for Grafana 10 and Beyond. Robert and Eugene Klimov also did a webinar, Showing Beautiful ClickHouse Data with the Altinity Grafana Plugin, that shows off the plugin in more detail.
ClickHouse® is a registered trademark of ClickHouse, Inc.; Altinity is not affiliated with or associated with ClickHouse, Inc.
very informative and insightful content