
Pipeline Optimization for ClickHouse® Distributed Tables with Synchronous Inserts

TL;DR: A Kafka to ClickHouse pipeline had ingestion lag stuck at about 8.6 seconds, even with a healthy cluster and idle CPU. The cause was synchronous inserts into Distributed tables. Each materialized view write had to wait for a remote shard to acknowledge it, adding a fixed network round-trip of about 3.3 seconds per execution. The system.query_views_log table made this visible. Redirecting one hot materialized view to write to its _local table instead of the Distributed wrapper cut end-to-end lag from 8.13 seconds to 3.87 seconds on average, roughly halving p95 and p99, while keeping the stability of synchronous inserts.
A streaming pipeline was stable but it had ingestion lag. The solution turned out to be a single change to where one materialized view wrote its rows, and the metrics showed exactly where to make it.
Introduction
A Kafka to ClickHouse pipeline had ingestion lag stuck at about 8.6 seconds, the cluster was healthy and CPU was idle. Tuning batch sizes did not help and consolidating low-volume topics did not help either. After some more digging and checking, the problem was that materialized views were inserting into Distributed tables while the cluster was using synchronous inserts. Each insert had to wait for a remote shard to acknowledge it before the view could finish.
Table system.query_views_log made that visible. The heavy views were spending about 3.3 seconds per execution, almost all of it in network wait, with CPU at only a few milliseconds. That is a fixed round-trip cost and it does not go away when you reduce volume. So the solution was simple: One hot materialized view was changed to write to its _local table instead of the Distributed wrapper.
After that change, end-to-end lag dropped from 8.13 seconds to 3.87 seconds on average. p95 and p99 were roughly cut in half as well. The result held for more than 24 hours at higher traffic, while keeping the operational stability of synchronous inserts. If you run a sharded ClickHouse cluster and have streaming lag that will not move no matter how much you tune throughput, this pattern is worth checking first.

The Setup
The pipeline is a straightforward Kafka to ClickHouse flow. Quotes land in Kafka, a materialized view consumes them into a Distributed table, quotes.ods_quotes, and a second materialized view enriches them into another Distributed table, quotes.quotes_eod. The cluster has two shards and two replicas per shard. The heavy write targets are all Distributed tables over ReplicatedMergeTree local tables and this detail matters because a Distributed table does not store data itself, it routes inserted rows to the shard that owns them.
Distributed tables can work in 2 modes. Default is asynchronous mode: an insert writes temporary files into a local spool directory and returns ACK to client right away, without blocking any operation. A background sender later reads those files and ships them to the destination shards. You can see the pending work in system.distribution_queue. In synchronous mode, the insert pushes rows to the destination shards and waits until they acknowledge receipt, like a normal INSERT. No spool files are created or background queue is involved. By the time the insert returns, the data is already on the shards.
This cluster ran in synchronous mode (distributed_foreground_insert = 1) on purpose. It hosts many Distributed tables across many tenant pipelines, all fed by high-frequency streaming inserts. Under asynchronous mode, those spooled files pile up faster than the background sender can drain them. That background sender uses a shared thread pool controlled by background_distributed_schedule_pool_size, which defaults to 16 and those threads are shared across all Distributed tables on the server, not reserved per table. With enough tables and enough insert frequency, the sender falls behind; even after increasing the pool to 32, the queue still ran away to roughly 525K files and tens of GiB across the nodes before the change was rolled back. Synchronous inserts avoided that spool problem entirely generating stability at the cost of a fixed round-trip per insert. That is the tradeoff.
To measure the impact, the pipeline used two timestamps on each row:
kafka_received_at: when the message arrived in Kafkach_received_at: aDEFAULT now()value recorded when ClickHouse consumed the row.
Lag was measured as ch_received_at – kafka_received_at. That number stayed around 8.6 seconds. The real question was not whether the pipeline was slow. It was where those 8.6 seconds were actually going.
Letting The Metrics Answer
Usually the first suspects are row volume, CPU, merges, or disk pressure but those metrics pointed somewhere else. ClickHouse records materialized view executions in system.query_views_log, including ProfileEvents. That makes it possible to break view time into wall-clock duration, network wait, CPU time, and other components. This query was enough to identify the problem:
SELECT
  view_name,
  count() AS execs,
  round(avg(view_duration_ms), 1)                                       AS wall_ms,
  round(avg(ProfileEvents['NetworkReceiveElapsedMicroseconds']/1000),1) AS net_ms,
  round(avg(ProfileEvents['OSCPUVirtualTimeMicroseconds']/1000), 2)     AS cpu_ms
FROM clusterAllReplicas('{cluster}', system.query_views_log)
WHERE event_time >= now() - INTERVAL 48 HOUR
  AND view_name IN ('quotes.ods_quotes_mv', 'quotes.quotes_eod_mv')
  AND status = 'QueryFinish'
GROUP BY view_name;
Here’s where the time actually went, as per materialized-view execution, before the change, from system.query_views_log. The views weren’t busy — they were waiting on remote shard acknowledgements. CPU time is a rounding error.
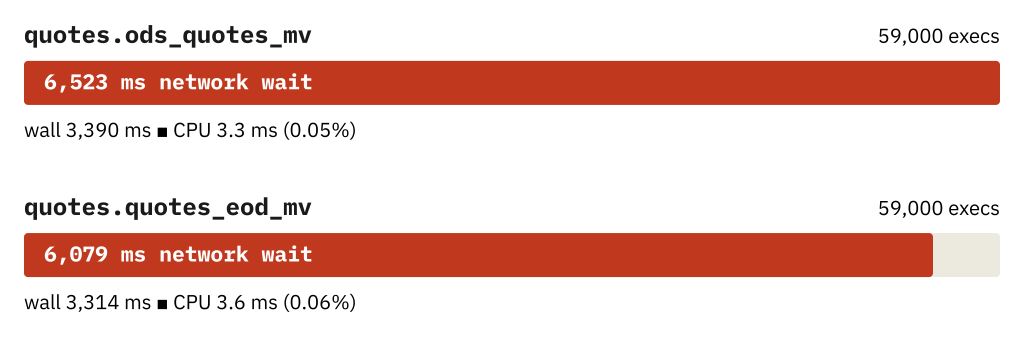
The result was clear. Each heavy view spent about 3.3 seconds per execution, and almost all of that time was network wait. CPU time was only a few milliseconds. net_ms being higher than wall_ms is expected here. A synchronous insert into a Distributed table fans out to multiple destination shards in parallel, and the network wait counters accumulate per-shard waits. The totals can add up to more than wall-clock time even though the waits overlap.
What matters is the shape of the result: the views were not busy doing work. They were mostly waiting for remote shard acknowledgements. We also checked the same views across a roughly 60x throughput range, from 13 to 778 rows per second. The per-execution cost stayed flat. That is a strong sign of a fixed per-insert round-trip, not a row-processing problem.
The Solution
Once the cost is identified as the cross-shard round-trip, the obvious next move is to get that round-trip off the critical path. The enrichment view was changed to write to its local table, quotes.quotes_eod_local, instead of the Distributed wrapper. That means the write stays on the consuming node and does not wait for a cross-shard acknowledgement. Replication still handles consistency and durability on the local table.
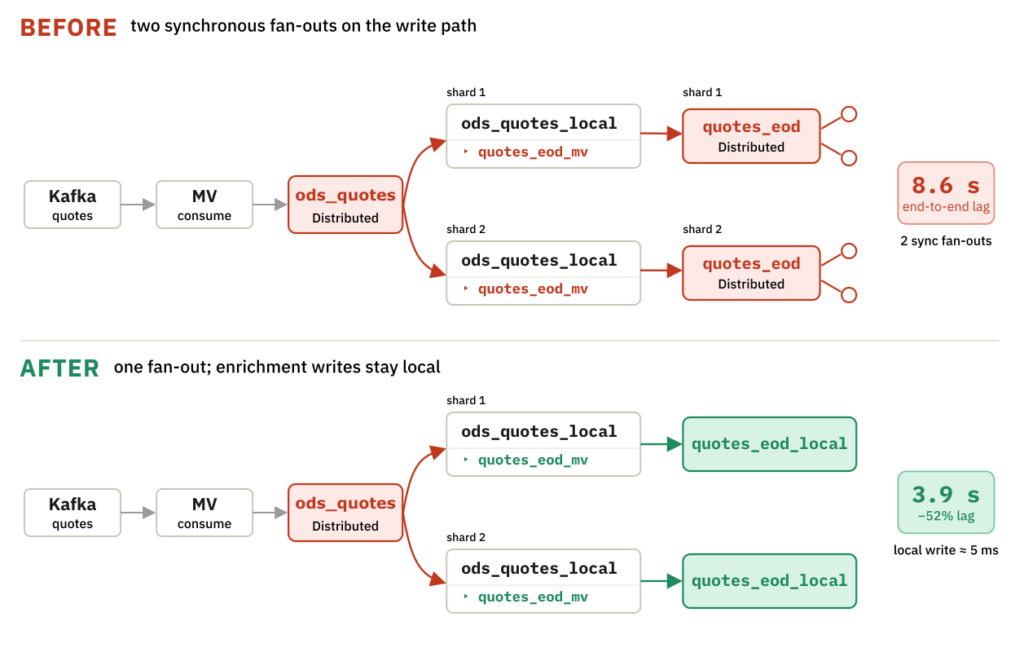
In the figure, this is the difference between the red fan-out tree branching twice and branching only once. Before the change, ods_quotes fans out to the shards, and then each shard-level materialized view writes into quotes_eod as another Distributed table, which triggers a second synchronous fan-out. After the change, the first fan-out still happens, but each shard-level materialized view writes into quotes_eod_local on the same shard, so the second red tree disappears and only background replication remains.
We could apply this approach because the target Distributed table used cityHash64(...) on a high-cardinality id, so shard assignment was already pseudo-random and primarily distribution-oriented. That is an important boundary condition. If a downstream table is sharded by tenant, account, or another locality-sensitive key, switching an MV to write directly to _local changes the placement model and may require a broader redesign rather than a simple latency optimization.
Also this cluster was only 2 shards. Imagine the fan out and lago for 5 or 10 shard cluster.
The Result
The changed view stopped paying the network cost, and the pipeline KPI moved immediately. This was the end-to-end lag on quotes.ods_quotes, measured as ch_received_at - kafka_received_at, comparing 24 hours before and after the change:
SELECT
  multiIf(ch_received_at < '2026-06-03 09:30:00', 'before', 'after')  AS window,
  count()                                                             AS rows,
  round(avg(ch_received_at - kafka_received_at), 2)                   AS avg_s,
  round(quantile(0.95)(ch_received_at - kafka_received_at), 2)        AS p95,
  round(quantile(0.99)(ch_received_at - kafka_received_at), 2)        AS p99
FROM quotes.ods_quotes
WHERE ch_received_at BETWEEN '2026-06-02 09:30:00' AND '2026-06-04 07:30:00'
GROUP BY window ORDER BY window;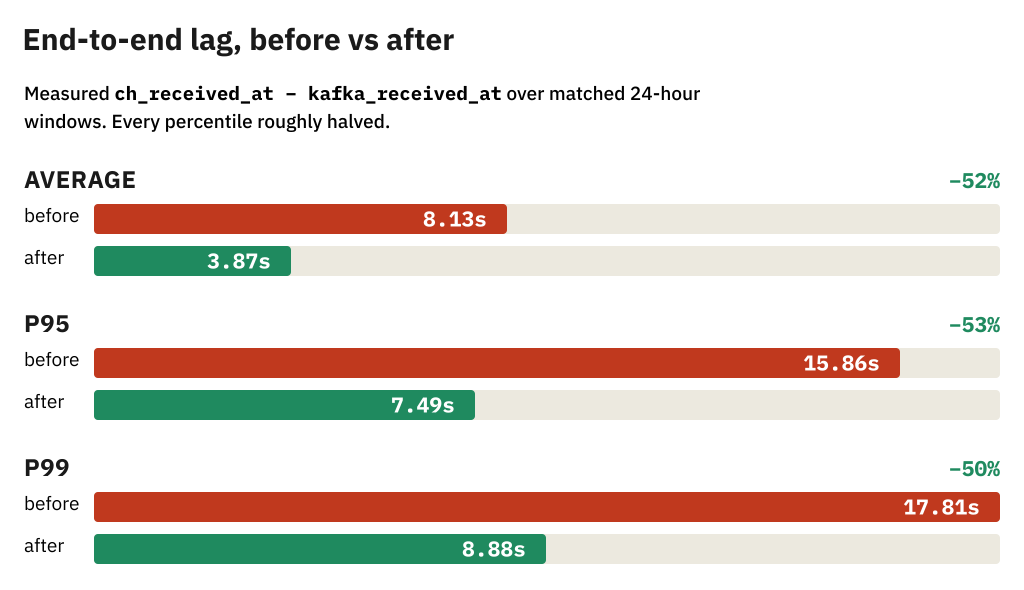
And now the mechanism, view by view, as per-execution wall time. The changed view’s cross-shard round-trip vanishes, and the untouched first hop becomes the remaining bottleneck:
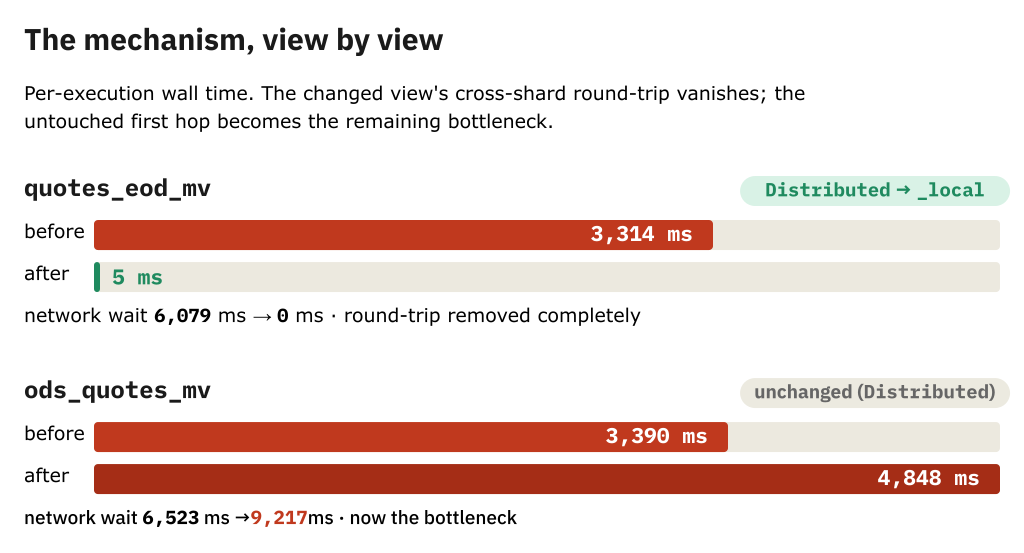
One thing also became clearer after the change: the first hop, which still writes to a Distributed table, became the remaining bottleneck. Its per-execution wall time went up because the consumer was no longer blocked downstream and started cycling more often on smaller batches. The fixed round-trip cost did not change. It simply became more visible.
Apply This to Your Own Pipeline
If you want to check for the same issue in your own pipeline, this is the order that worked here.
1. Measure lag directly
Use a source timestamp and an ingest timestamp if you have them. If the lag stays roughly flat when traffic goes up and down, that points to a fixed per-insert cost rather than a throughput bottleneck.
2. Break down materialized view time with system.query_views_log
Run the per-view query and compare wall_ms, net_ms, and cpu_ms.
The pattern to look for is:
net_msclose to or higher thanwall_mscpu_msclose to zero- no meaningful disk or Keeper time if you include those counters
That means the view is mostly waiting on the network.
3. Check whether the hot views write into Distributed tables
Use these queries:
SELECT database, name
FROM system.tables
WHERE engine = 'Distributed';

SELECT name, value
FROM system.settings
WHERE name IN ('distributed_foreground_insert', 'insert_distributed_sync');
If the slow view writes to a Distributed target and the cluster is using synchronous inserts, you likely found the bottleneck.
4. Compare with a local-target view on the same cluster
Find a materialized view that writes to a MergeTree or ReplicatedMergeTree target and compare its timings. If it runs in single-digit milliseconds with no network wait, that is a strong control case. It shows that the cluster itself is not the problem.
5. Check sharding and dedup before redirecting writes
This is the main safety check. Writing to _local changes where rows land. Instead of being routed by the Distributed table sharding key, rows stay on the node that consumed them.
That is usually fine only if:
- the pipeline does not require cross-shard routing at write time
- rows that must deduplicate together still land on the same shard.
For ReplacingMergeTree targets, make sure the producer partition key and the original Distributed sharding key line up closely enough for that guarantee to hold.
6. Repoint the hot materialized view to _local
Recreate the materialized view so it writes to the local table instead of the Distributed wrapper. This is a metadata change in the write target. It does not require a server restart.
7. Re-measure over equal time windows
Run the lag KPI again. Run the query_views_log query again. Split the results at the change time. The expected result is that network wait drops toward zero for the changed view and the end-to-end lag drops with it.
If another stage in the chain still writes to Distributed, repeat the same process there.
Closing Notes
Synchronous Distributed inserts can be the right operational choice, but on a hot streaming path they can also become the main source of lag. In this case, system.query_views_log showed that one materialized view was mostly waiting for remote shard acknowledgements, and changing its target from Distributed to _local removed about half of the end-to-end delay without giving up the stability of synchronous inserts.
ClickHouse® is a registered trademark of ClickHouse, Inc.; Altinity is not affiliated with or associated with ClickHouse, Inc.