Announcing the Multi-Platform Altinity Tableau Connector for ClickHouse®

Last year we released the first version of the Altinity Tableau Connector for ClickHouse. It was quite popular but had one drawback. It was based on the ClickHouse ODBC driver, which works fine on Windows platform but is difficult for users to utilize on other platforms like MacOS & Linux. Also, it was not really compatible with Tableau Server.
To solve the problem we are releasing a new version of this connector that is based on JDBC protocol and uses the official ClickHouse JDBC driver. This article explains how the connector works and how to install it on Tableau Desktop followed by Tableau Server.
Getting Started
Let’s quickly remind everyone how Tableau works with different databases. To properly work with any database it requires at least 2 components. The first is a database driver that is responsible for connecting to the database and sending SQL statements over the network. The second 2nd is the connector which provides Tableau metadata about the database supported features and SQL syntax. This helps Tableau to generate SQL statements that use native database syntax.
The new Tableau Connector is based on the ClickHouse JDBC driver, which is written in Java. and compatible with any platform where Tableau runs. You don’t need to have a different version of the driver for every platform. So the installation procedure is now very simple on any platform. You just download 2 files (JDBC driver + connector) and save them into the appropriate directory. That’s all! And these files are the same for all platforms.
Tableau Desktop Installation
Let’s do it for Tableau Desktop first and then on Tableau Server. This is a repo with a new connector. You can always take the latest driver and connector from here.
1. Download the Clickhouse JDBC Driver from here ( you need this file “clickhouse-jdbc-0.3.2-patchXX-shaded.jar”) and place the file in the following location base on your operating system:
- macOS: ~/Library/Tableau/Drivers
- Windows: C:\Program Files\Tableau\Drivers
If the folder doesn’t exist then you need to create it.
2. Download the latest clickhouse_jdbc.taco from here and place it in:
- macOS: ~/Documents/My Tableau Repository/Connectors
- Windows: C:\Users\[Windows User]\Documents\My Tableau Repository\Connectors
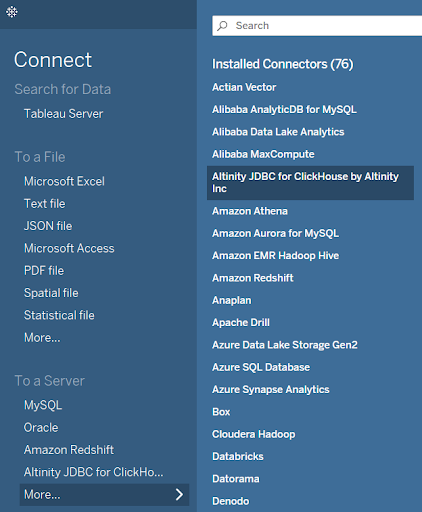
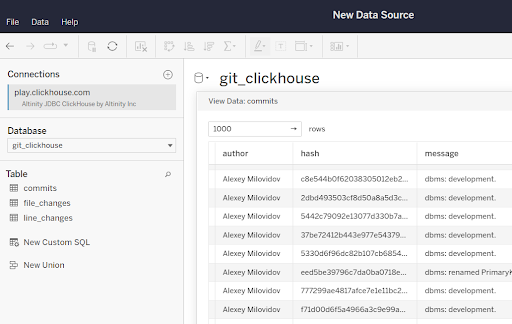
3. Run Tableau Desktop and ensure that you see “Altinity JDBC for ClickHouse” in the supported connections. Here is a screenshot.
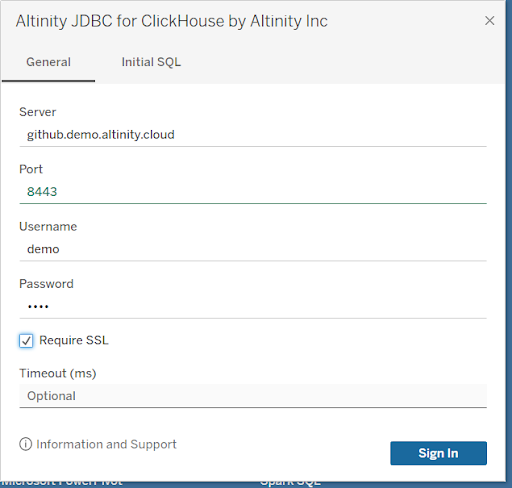
Now try to connect to ClickHouse to check if it works. I used these credentials to connect to the dataset that is available in Altinity Cloud to the public.
Host: github.demo.trial.altinity.cloud:8443
User: demo
Password: demo
Once you connect, you will see a list of available databases in ClickHouse and can browse data.

Tableau Server Installation
It’s the same easy procedure for the Tableau server.
- Download the Clickhouse JDBC Driver here ( you need this file “clickhouse-jdbc-0.3.2-patchXX-shaded.jar”) and place the file in the appropriate folder for your operating system.
- Windows: C:\Program Files\Tableau\Drivers
- Linux: /opt/tableau/tableau_driver/jdbc
If this folder doesn’t exist then you need to create it. Also check that Tableau has access to the directory. Here are sample commands for Linux.
sudo mkdir -p /opt/tableau/tableau_driver/jdbc
sudo cp [/path/to/download driver file name] /opt/tableau/tableau_driver/jdbc
sudo chmod 755 /opt/tableau/tableau_driver/jdbc/[driver file name].jar- Download the latest clickhouse_jdbc.taco here and place it in the appropriate folder:
- Windows: C:\Program Files\Tableau\Connectors
- Linux: /opt/tableau/connectors
- Now we need to restart Tableau Server. Just run the command “tsm restart”. It will take some time, usually less than 10 mins. (Every time when you make any changes, such as adding/updating a driver or connector you need to restart the server.)
- If you have more than one instance of Tableau Server you need to repeat steps 1-3 on each node.
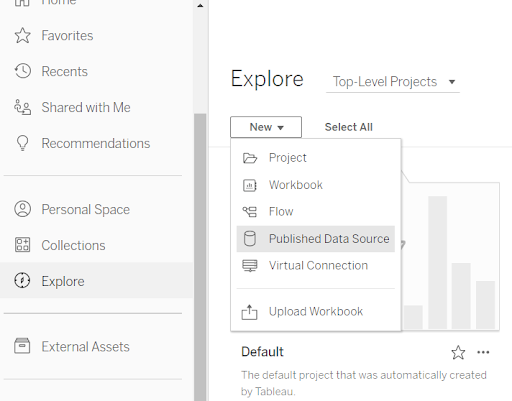
- Now let’s check that Tableau Server has “Altinity JDBC for ClickHouse” in supported connections. For this we need to open the browser and login in Tableau Server Web UI. Once you logged in go to “Explore” menu and choose “Published Datasource
You should see a new dialog window with a list of supported connections and “Altinity JDBC for ClickHouse” should be there. If you don’t see it – check the Tableau Server logs for any errors since last startup. It’s likely the server does not have access to the file or folder with connector/driver.
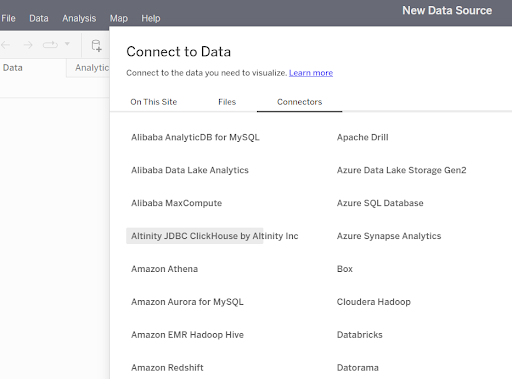
Choose “Altinity JDBC for ClickHouse”, enter credentials, and check that you see data.
That’s it! Both Desktop and Server are able to connect to ClickHouse.
Publishing a Dashboard with the new Driver
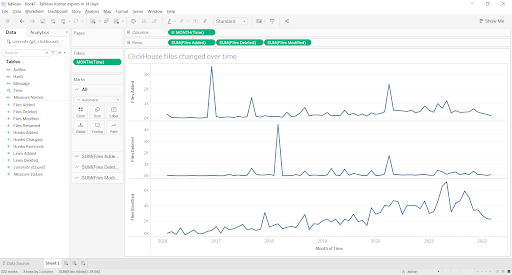
We can do one more simple test to verify that the full life cycle of Tableau Dashboard development works fine. Let’s create a simple workbook in Tableau Desktop and publish to Tableau Server.
I quickly created a chart that shows the number of added/changed/deleted files in the ClickHouse git repository over time. The data comes from the github server.
And now I’m going to publish it to Server. For that I need to sign in to the Server from Desktop. Go to the menu “Server” -> “Sign in ”. Enter your credentials. Now go to “Server” -> “Publish WorkBook”, choose the folder, name and push “Publish.”
Once it’s finished you can open this workbook in the browser (or from tablet/ smartphone) and see the chart. Would like to emphasize that this published dashboard uses a live connection to ClickHouse. It means that every time you open it Tableau Server generates a SQL query, sends it to ClickHouse and you see live data from ClickHouse.
Conclusion and More to Come
This article covered Altinity’s new JDBC-based Connector for ClickHouse. We showed how to install and use the connector on both Desktop and Server versions of Tableau. The next step is to make it work with Tableau Cloud. Stay tuned. We’re working on that as well.
Meanwhile please try out the new Tableau Connector. You can contact us through this website to find out more or join us on Slack. Have fun exploring your ClickHouse data!
ClickHouse® is a registered trademark of ClickHouse, Inc.; Altinity is not affiliated with or associated with ClickHouse, Inc.