Observability & Logging with ClickHouse®
Manage high-volume observability data efficiently
Gain real-time insights from vast volumes of logs, traces, and metrics in a single database—while keeping costs in check.
Why use ClickHouse for observability and logging?
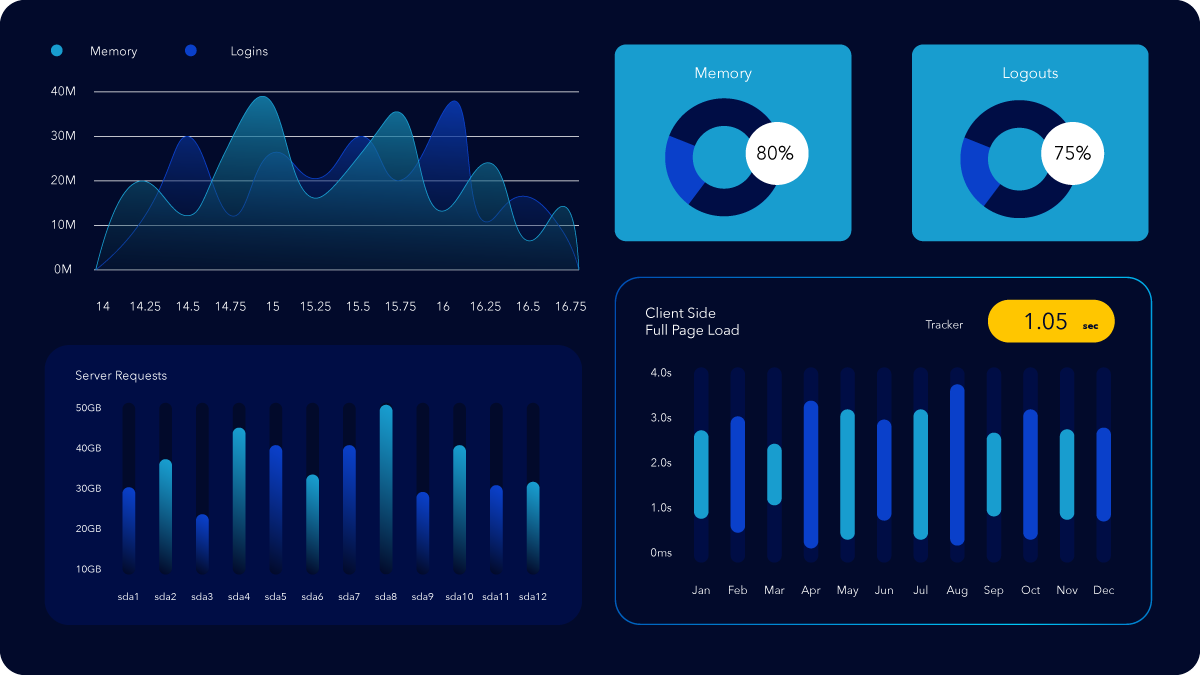
Get Immediate, Up-to-Date Answers on Operational Status
Leverage materialized views and tiered storage to keep your data organized and optimized. New data is immediately available for query, ensuring it’s always ready for your critical alerting and operational dashboards.
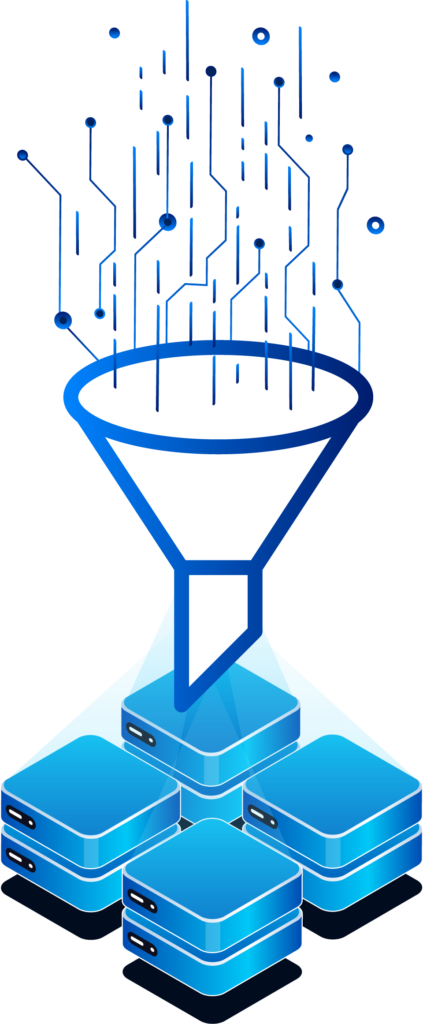
Handle Extreme Cardinality Effortlessly
ClickHouse excels at managing high-cardinality datasets, allowing you to handle diverse and detailed metrics without sacrificing performance. Perfect for large-scale observability needs where every data point matters.
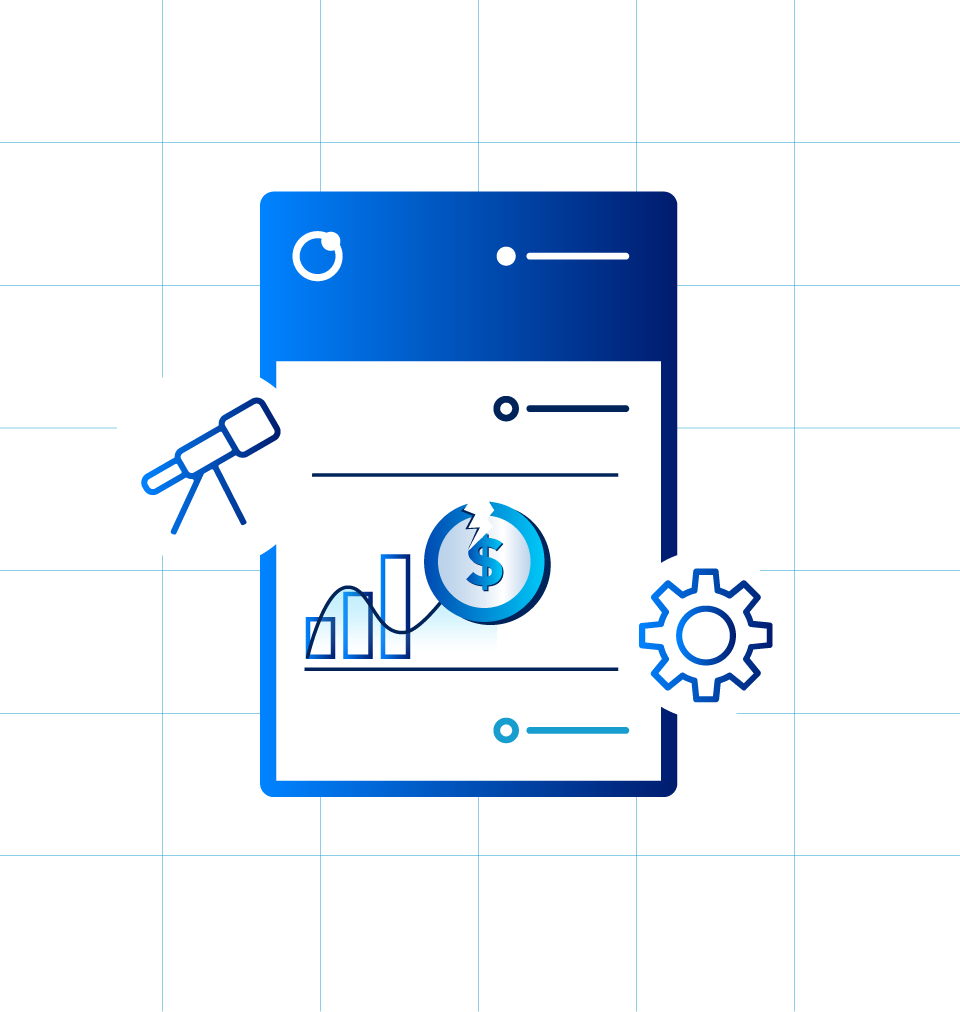
Replace Costly and Difficult-to-Manage Alternatives
Bills for Datadog can run into tens of millions of dollars. ElasticSearch is great for search on unstructured data but hard to manage in observability use cases. ClickHouse is open source, cost efficient, and you can integrate with other open source tools like Grafana and OpenTelemetry.
Read some of our blogs
Altinity Loves Every Observability Vendor (Especially the Ones That Use ClickHouse®)
Struggling to choose an observability platform? Compare SaaS and open source options—and discover how ClickHouse® fits into the picture.
KubeCon Recap: Data on Kubernetes and Observability with ClickHouse®
Data on Kubernetes Day at KubeCon 2024 was filled with great sessions on analytics and observability. Here’s Josh Lee’s recap from Salt Lake City.
How to Monitor Metrics and Logs From Altinity.Cloud in Grafana Cloud
With the Altinity Cloud Manager, it’s easy to use Grafana, Prometheus, and Loki to visualize ClickHouse clusters and the data they manage.


We thought of you as a trustworthy partner, not just like a tool; we got an understanding of how well you know ClickHouse. We were able to open a Slack channel even before buying things.
Altinity.cloud Customer