Guest Post: PolyScale Metrics with ClickHouse® Materialized Views

Guest post from Matt Calder.
Editor’s Note. PolyScale.ai is an Altinity.Cloud customer and recently documented their journey into ClickHouse materialized views on the PolyScale Blog.
We’re delighted to repost the article (with Polyscale’s permission) about their experiences with ClickHouse as well as with Altinity software & resources.
PolyScale Observability
PolyScale is a global database cache as a service. Using PolyScale, database data can be distributed and cached, seamlessly scaling your current database without altering transactional semantics.
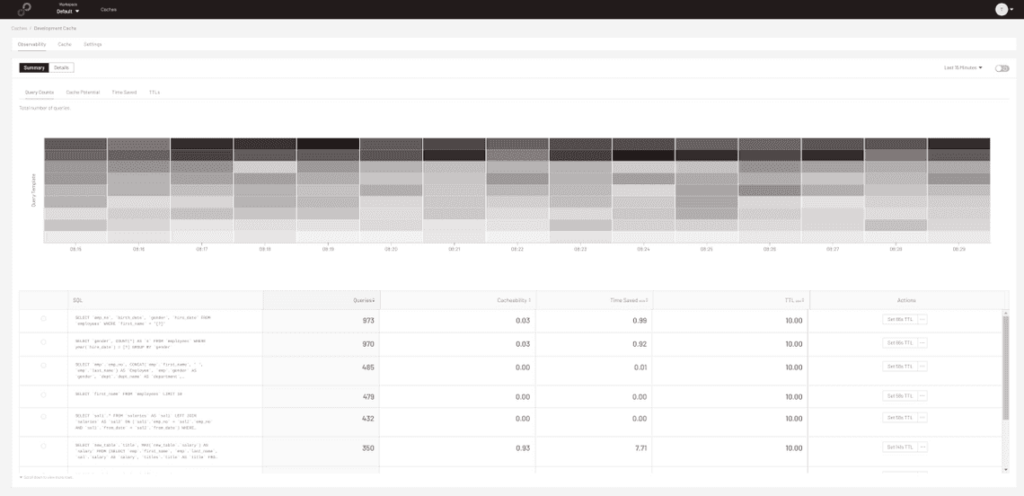
In addition to the performance improvements provided by caching, PolyScale’s Observability Interface allows developers to gain insight into the query traffic generated by their application. This insight leads to important discoveries that are hard to come by in other ways; opportunities for optimization and lurking inefficiencies are revealed.

Observability Interface
In order to power this interface, PolyScale relies on ClickHouse.
ClickHouse is a column-oriented database management system for online analytical processing of queries. It has several features that make it particularly well suited for powering PolyScale’s Observability Interface: it is amazingly fast, it is simple to expand the schema with new metrics, and its modern SQL support makes writing queries a breeze. However, there is one feature that we at PolyScale have relied on for our analytics stack that makes it a truly great fit, that feature is Materialized Views.
Materialized views solve a common problem faced when developing a metrics pipeline. The sheer volume of data needed to gain real insight is at odds with the real time interactive user experience needed to arrive at those insights. Materialized views provide the automation necessary to aggregate the details into usable information.
It is worth noting that PolyScale runs ClickHouse on Altinity.Cloud. Altinity manages our ClickHouse server and allows us to focus on managing the data. In addition to the hosting service, they also provide a deep stack of support expertise and documentation. Most of what is described here in regard to materialized views was learned directly from Altinity.
PolyScale Metrics
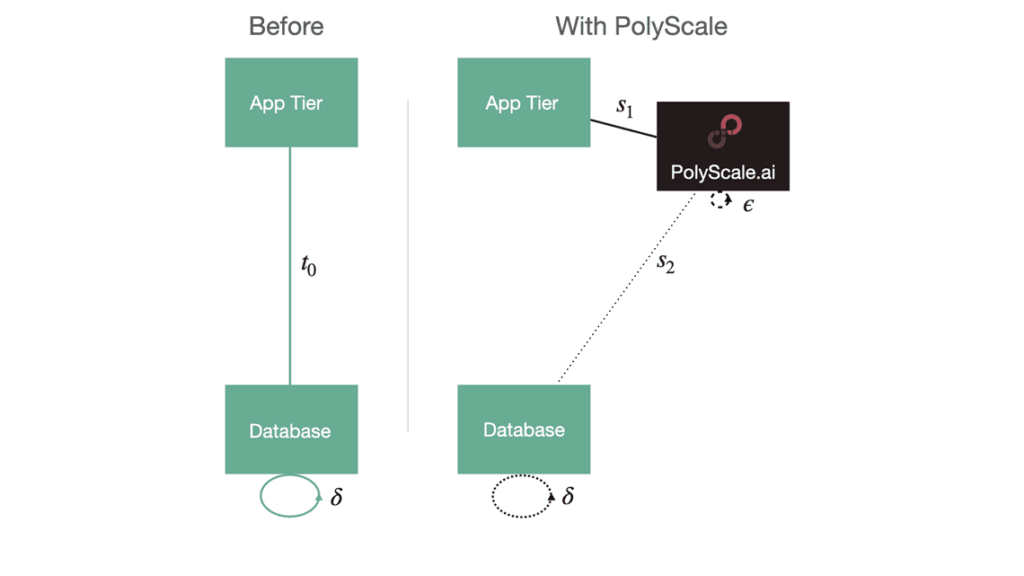
PolyScale cache as a service proxies our client’s database server, all query traffic that would go to the database goes to PolyScale first. Each and every client query eventually yields a metric, a collection of measurements of the query itself, and details of how it was processed by various stages of the PolyScale caching system.
PolyScale takes data protection very seriously; all queries and query parameters are anonymized aggressively early on in this process. This pipeline results in a lot of metrics, thousands per second, each one containing hundreds of pieces of information. It is this data that lands in ClickHouse.

PolyScale Proxy
These raw query metrics contain a treasure trove of useful information. Information on query traffic patterns, profiling information on the PolyScale services, and telemetry on the automated caching algorithms. However, in order to support the dynamic and interactive Observability Interface, there’s simply too much information present. Queries against the raw metrics data have to scan through millions of rows across hundreds of columns; even ClickHouse with its amazing capabilities gets bogged down.
Rollup Tables
The trick to serving relevant information at speed is to pre-aggregate the raw metrics into higher-level information of interest. Typically, this involves aggregating over time, going from the raw metrics where each individual query event is represented to tables with summary statistics for each minute, or each hour, or each day. These aggregate tables are well matched to the views available in the Observability Interface which present time series data over a variety of timescales. ClickHouse materialized views make this process simple and straightforward.
To make this concrete, consider the following simplified metrics table.
| Timestamp | QueryHash | ResultHash | Hit |
| 1660586303106 | x93d23 | x3f650 | 0 |
| 1660586303107 | x8837c | x1a4b3 | 0 |
| 1660586303111 | x93d23 | x3f650 | 1 |
Each query generates a metric containing a timestamp, a query hash representing the query, a result hash representing the query result, and an indicator of whether the query resulted in a cache hit or a cache miss.
Assume that a rollup table that would be suitable for a simple user interface consists of a row for each minute and each query seen in that minute, a count of the number of times the query ran, a count of the number of cache hits, and an array of the unique result hashes. Like so,
| Minute | QueryHash | nQuery | nHit | ResultHashes |
| 1660586936400 | x93d23 | 782 | 657 | [x3f650, x9812c] |
| 1660586936400 | x8837c | 1912 | 1802 | [x12237, xab435] |
| 1660586940000 | x93d23 | 1593 | 1434 | [x9812c] |
ClickHouse materialized views make it simple to maintain this rollup table and to keep it synchronized with the raw data table.
Materialized Views
A materialized view in ClickHouse is very much simply a trigger. When data is inserted into the raw metrics table, that inserted data is also inserted into the materialized view which in turn aggregates and then distributes the result into a target table. It is important to understand that the materialized view takes as its input the inserted data; it does not directly interact with the raw metrics table. Materialized views provide a mechanism for “forking” the insert process, and sending copies of the inserted data into multiple recipient tables. In addition, materialized views allow one to add an aggregation step into any of these forks in the data flow.
At PolyScale, there are four specific tables associated with each materialized view: the raw metrics table, the target rollup table, the materialized view itself, and there is what we term the convenience view. Strictly speaking one can get by with just the raw table and the materialized view, but we prefer the explicit and consistent representation of the four tables.
Continuing with the example given above, the raw metrics table might be defined as:
create table if not exists raw_metrics
(
    timestamp Int64,
    queryHash String,
    resultHash String,
    isHit Bool
)
engine = MergeTree()
order by (timestamp)
The following target rollup table will receive the data from the materialized view. It represents the desired rollup.
create table if not exists minute_metrics_tt
(
    minuteI Int64,
    queryHash String,
    nQueryState	AggregateFunction(sum, Int64),
    nHitState AggregateFunction(sumIf, Int64, Int8),
    resultsState AggregateFunction(groupUniqArray, String)
)
engine = AggregatingMergeTree()
order by (minuteI, queryHash)
The table engine is the special AggregatingMergeTree and the column data types for the rolled up metrics are AggregateFunction. The first argument to the aggregate function is the name of the aggregate function (most if not all of ClickHouse’s rich array of aggregate functions are supported) and the subsequent arguments are the data types of the aggregate function. It is traditional to name the aggregating columns using the suffix “State” because the value stored in the table is not a plain old data value, but instead is the entirety of the state needed to compute and update the aggregated value.
The materialized view populates the target rollup table. It consists of a select query with a group by operation. The select call is written as if it is run against the raw metrics table but in fact, it runs only against any inserts into the raw metrics table. The group by of the materialized view query must align to the order by clause of the target rollup table (minuteI, queryHash) in this example.
Here is the materialized view:
create materialized view if not exists minute_metrics_mv
to minute_metrics_tt
as select
cast(timestamp / 60000 as int64) as minuteI,
    queryHash,
    sumState(toInt64(1)) as nQueryState,
    sumIfState(toInt64(1), cast(isHit as UInt8)) as nHitState,
    groupUniqArrayState(resultHash) as resultsState
from raw_metrics
group by minuteI, queryHash
The insertions into the target rollup table are done by column name. Therefore, it is important that the column names referenced in the materialized view exactly match those in the target rollup table.
The final table is just a view on the rollup target table. Because that table consists of aggregation state columns, a special merge operation needs to be called on the columns to get at the actual aggregated value. This can be neatly hidden by wrapping the rollup table in a view like so:
create or replace view minute_metrics
as select
minuteI,
    queryHash,
    sumMerge(nQueryState) as nQuery,
    sumIfMerge(nHitState) as nHit,
    groupUniqArrayMerge(resultsState) as resultHashes
from minute_metrics_tt
group by minuteI, queryHash
When querying the rollup data, this view allows us to ignore the special handling the state columns otherwise require.
The four table rollup chain as it referred to at PolyScale is not the only means to construct a materialized view. There are various shortcuts one can take with some aggregation functions that reduce the amount of syntax required. However, the method described has the advantage of consistency and clarity at the expense of a little verbosity.
Insert and Roll
When data is inserted into the raw metrics table it will also be aggregated into the minute rollup table due to the existence of the materialized view. Inserting data into the raw metrics table:
insert into raw_metrics (timestamp, queryHash, resultHash, isHit) values
(1660586303106, 'x93d23', 'x3f650', 0),
(1660586303107, 'x8837c', 'x1a4b3', 0),
(1660586303111, 'x93d23', 'x3f650', 1),
(1660586303112, 'x93d23', 'x3f650', 1),
(1660586303114, 'x93d23', 'x3f650', 1),
(1660586303115, 'x8837c', 'x990a8', 0)
Yields the following in the minute rollup table:
| minuteI | queryHash | nQuery | nHit | resultHashes |
| 27676438 | x8837c | 2 | 0 | [x1a4b3, x990a8] |
| 27676438 | x93d23 | 4 | 3 | [x3f650] |
There’s no limit to how many materialized views can be connected to a base table. At PolyScale we have rollup tables for one minute, one hour, six hours, and twelve hours that feed the various timescales in the Observability Interface. We also have materialized views that aggregate on things other than time which we use for other purposes.
End Notes
The above introduction to ClickHouse materialized views was just that, an introduction. A number of optional steps were glossed over, and some detail was intentionally skipped over.
To learn more about materialized views, view the excellent webinars on the topic made by Altinity:
And for an even more in-depth read, try these slides by one of the Altinity support engineers:
To see how PolyScale can seamlessly scale your existing data architecture have a look at
And to see an example of how we use materialized views see
Finally, try a real-life interactive PolyScale demo in just 2 minutes. Or sign up for a free account.
ClickHouse® is a registered trademark of ClickHouse, Inc.; Altinity is not affiliated with or associated with ClickHouse, Inc.
