Altinity Loves Every Observability Vendor (Especially the Ones That Use ClickHouse®)
The Observability Challenge
Modern systems generate an overwhelming amount of telemetry data – metrics, logs, traces, and more. Capturing this firehose of information is just the first step; the real challenge comes in *using this data effectively*.
This is why observability tools are so important. They are the final step in converting telemetry signals from arbitrary bits into actionable insights.
For the past few years I’ve been obsessed with observability. If we cut through the marketing, I’m in love with the promise at the heart of observability: our systems should self-report with enough detail that we can understand and modify their operations easily.
I spend a lot of time talking in public about observability, and because of this I often get the question — which platform should I choose? Well, I have some opinions. As a disclaimer, I have only cursory first-hand experience with some of these platforms. My opinions are based on countless conversations with practitioners, and several years of experience working in the field.
ClickHouse: The Perfect Fit for Observability Data
Of course I’m biased, but I think ClickHouse’s architecture offers several advantages that make it particularly well-suited for observability workloads:
1. Columnar storage format optimized for analytical queries on time-series data
2. Exceptional compression reducing storage requirements by 10-100x
3. Blazing-fast query performance even across billions of rows
4. Flexible schema design supporting both structured and semi-structured data
5. Efficient search for log analysis
If you’re trying to build your own in-house observability platform, I’d definitely recommend that you give ClickHouse a long and hard look.
But building a complete observability platform from scratch is no small feat, and it’s certainly not an endeavor that every organization should embark on.
This is where we turn to observability vendors and open source platforms.
How do Observability Platforms work?
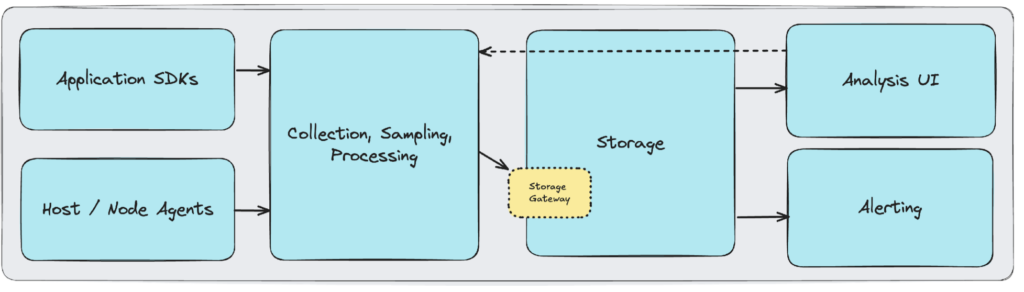
Whether self-hosted or SaaS, most observability platforms offer similar architectural elements:
- An Application SDK – This allows your applications to send telemetry, either to a node agent or to directly to the platform’s ingestion API.
- A Node Agent – In addition to gathering resource metrics, these act as reverse proxies, forwarding node- and application-telemetry to the platform’s ingestion API.
- An Ingestion API – This is the gateway to the platform’s storage and backend analysis tools.
Previously, every vendor necessarily offered their own proprietary application SDKs and node agents. This is no longer the case, and the OpenTelemetry SDKs and OpenTelemetry Collector have dramatically lowered the barrier to entry for new vendors within the Observability SaaS space.
Established vendors have also embraced OpenTelemetry — although to varying degrees. Some of them offer open-source agents and SDKs based on forks of OpenTelemetry components. Others integrate with OpenTelemetry by exposing compatible APIs — either in their agents, backends, or both.
Choosing an Observability Solution
Although OpenTelemetry is often promoted as a way to make switching observability platforms effortless, the reality isn’t quite that simple. While it’s true that OpenTelemetry’s standardized instrumentation eliminates the need to re-instrument applications, the broader observability infrastructure quickly becomes deeply intertwined with your existing DevOps stack.
Operators and SREs naturally settle into the platform, creating customized dashboards, alerts, and workflows that become integral to daily operations. Given this level of integration and investment, it’s critical to select an observability platform that can effectively support your team’s needs for years to come.
The main decision point will be build-vs-buy, which is not actually a binary choice but a matter of degree: many self-hosted open-source solutions are offered by organizations that are also capable of providing the enterprise support and service of a traditional SaaS.
There are some other important considerations to take into account:
- Compatibility & Scope: Observability is most useful when it is comprehensive. This can be both a technical and organizational challenge. OpenTelemetry, widely supported by vendors and open-source tools, has largely leveled the playing field from a technical point of view. From an organizational perspective, you will want to look for the tool that will be the easiest to onboard new teams onto.
- Agent Options: Some platforms will offer a proprietary agent, while others will offer distributions or forks of the OpenTelemetry Collector. Neither is better for all use cases, so you will want to decide based on your organization’s preferences for customizability vs tight vendor integration and support.
- Time-to-Value: The sooner you can begin to demonstrate value from an observability solution, the faster you will be able to convince all teams to onboard. Traditional monitoring with metrics and logs offers a gentle on-ramp, while distributed tracing can take longer to show value — but this is changing with tools like eBPF, and with the widespread adoption of OpenTelemetry instrumentation in frameworks and libraries.
- Customizability: Some tools are opinionated, which can lead to faster time to value. Other tools offer greater customization and flexibility but may take longer to learn and adopt — think Jira. Most solutions fall somewhere in the middle, offering opinionated defaults with a degree of customization options.
- Pricing Model: Of course, total cost of ownership is important, but the pricing model also plays a role in how the tool will be used. For example, a charge-per-GB-ingested model will incentivize carefully crafted payloads, while a charge-per-event model will reward complicated sampling strategies and arbitrarily wide payloads. With self-hosted solutions, cost can also be controlled on the back-end management of the data.
- Runtime Control: Look for platforms that allow you to manage your telemetry without code changes. The ability to filter, enhance, or redirect data flows in runtime can dramatically reduce operational overhead while maintaining observability coverage as your needs evolve.
- Data Accessibility: Consider how easily you can access your telemetry outside the platform. Open standards for querying and APIs that enable data portability prevent vendor lock-in and support integration with your existing tools and workflows.
SaaS Observability Platforms
The SaaS model can be very attractive: Send the vendor all of your telemetry and they will turn it into “insights”. But it also comes with a set of costs. First, there is the cost of the vendor itself. Then, there is the cost of transmitting all of this data to the vendor. This can be a significant expense, especially for large or distributed applications.
Furthermore, the vendor model can limit the amount of data that you can collect and process: Vendors have to be careful not to take on too much data, or their costs will spiral out of control. And finally, there is the cost of vendor lock-in: Once you have chosen a vendor, it can be difficult to switch to a different one.
That being said, these platforms can be a good choice for teams that have limited in-house resources for managing self-hosted observability solutions — or who do have resources but want to spend them elsewhere.
Datadog, Splunk, Dynatrace, and New Relic are all excellent tools that are market leaders for a reason. These companies represent the “old-guard APM” wing of observability, but they have done a great job of keeping up with developments like distributed tracing and OpenTelemetry.
Ok, maybe you’re looking for something a little more modern: Honeycomb’s founders literally wrote the book on Observability (and coined the term). Their bubble-up tool for evaluating wide events is a game-changer, and it’s especially effective in the hands of empowered engineering teams.
Honeycomb offers an event-centric view of your system that doesn’t differentiate between different telemetry signals — everything is queried through a single interface. Operators can visualize query results as a heatmap, select an area of the heatmap, and then quickly see the unique shared characteristics of the highlighted events. This makes it a one-step process from a user-centric question like “Why are these specific user requests slow” directly to an actionable query — awesome!
The (only) complaint I’ve heard about Honeycomb is that you do have to think about how you use it — the pricing model can lead to complex sampling strategies. Sampling is great in theory — of course not every `200 OK` trace span is valuable — but in practice, knowing in advance which telemetry to discard is as much art as science.
So, if messing with sampling rules is not your thing, then you’ll want to take a look at either Last9 or IBM Instana. Both offer 100% unsampled tracing — powered by ClickHouse (of course). Both also include proprietary time-series databases for near-real-time alerting. (Full disclosure — I was a Product Manager at Instana).
Beyond those similarities, they each have their own unique spin on observability.
Last9 stands out with its control plane architecture that lets teams manage telemetry in runtime without redeployments — combining unsampled ClickHouse tracing with cost control through runtime data management.
Of course, you should also check out Dash0, which is like Instana but with less “enterprise” and more OpenTelemetry. Both Dash0 and Instana offer a resource-centric UI that allows for easy navigation around entities that we care about (like VMs, containers, etc) rather than around telemetry-signal silos.
If you’re more into metrics and logs than distributed tracing, then BetterStack offers a modern approach that natively speaks both OpenTelemetry and Prometheus. Their high-cardinality and cost-effective time-series storage is powered by — you guessed it — ClickHouse.
Rounding out our review of SaaS offerings we have Logz.io — a hosted solution built on open standards like OpenTelemetry and ClickHouse; and then there is Ooodle.ai, which offers efficient time-series storage and an AI-powered query engine that is kind of like Honeycomb’s bubble-up, but specifically for time-series.
Open Source Observability Platforms
Now you may be saying, “Josh, I don’t want SaaS, I want an open-source tool that I can self-host!”
Of course you do. And I’ve got you covered.
Grafana (LGTM Stack)
The Grafana stack is the unquestionable default when it comes to open source monitoring. It’s also just fun to say that you’re on the “LGTM” stack — even if the acronym no longer fully captures the breadth of Grafana’s offerings:
- Prometheus is the standard for open-source metrics, with exporters available for pretty much everything under the sun. Its ubiquity has inspired many more-performant and scalable alternatives, including VictoriaMetrics as well as Grafana’s own Mimir.
- Loki as a platform for log aggregation is both simple and scalable. We use Loki extensively within our own monitoring for Altinity.Cloud.
- Grafana is the gold-standard for custom-dashboarding UI, and the huge library of community-created dashboards make it easy to get started. Through the Altinity Kubernetes Operator, we provide several dashboards for monitoring ClickHouse instances with Grafana.
- Alloy is Grafana’s open source node-agent. It replaces promtail as an agent for shipping logs, adding all of the capabilities of an OpenTelemetry Collector under the hood.
- Pyroscope is leading the effort to bring continuous process profiling to OpenTelemetry, and is an excellent tool for performance tuning of individual services.
Did you know that Grafana dashboards can easily be fed by a ClickHouse database? In fact, ClickHouse makes a very performant alternative as a time-series database or as a destination for bulk logs and traces.
QRYN
While qryn is not a complete observability solution on its own, it offers a powerful compatibility layer for observability signals, leveraging ClickHouse materialized views for projections into various formats from raw data. This also enables the use of ClickHouse as a high-performance OLAP backend for common tools like Prometheus, Tempo, and OpenTelemetry. PromQL with ClickHouse speed and scalability? Yes please!
- Send telemetry data to qryn via any compatible API: Prometheus, Influx, Loki, OpenTelemetry, Tempo, Zipkin, SNMP, Elastic, New Relic, Datadog, and even curl. Yes — qryn can speak some of the vendors’ proprietary formats. The data all gets stored efficiently in ClickHouse.
- Query data by connecting qryn’s compatible APIs: TempoQL, PromQL, and LogQL. All telemetry of the same type (traces, metrics, logs) is unified into a single interface. When combined with Grafana’s tools for visualization, this makes for a powerful and widely-compatible observability engine.
SigNoz
SigNoz is a fantastic open-source observability platform built directly on top of ClickHouse, giving it exceptional query speed and scalability. Think of it as a traditional monitoring tool reimagined for a fully OpenTelemetry-native world, with support for all signal types. SigNoz can be self-hosted or utilized as a managed SaaS offering, making it suitable for teams of all sizes.
- Correlation of OpenTelemetry signals is a standout strength of SigNoz, offering powerful trace, log, and metric integrations that simplify troubleshooting across your entire system.
- SigNoz excels in cross-service tracing, even providing advanced, not-yet-in-spec correlation features for message queue consumers, making it ideal for complex, asynchronous workflows.
Coroot
Coroot is another robust open-source observability platform leveraging ClickHouse for efficient and performant data storage. Available for self-hosting with enterprise support, Coroot stands out by significantly lowering the barrier to effective monitoring.
- Its unique zero-config setup means you can start collecting tracing and metrics instantly, thanks to built-in eBPF instrumentation. This eliminates the typical overhead associated with configuring exporters and instrumentation agents.
- Coroot provides an opinionated, intuitive UI designed explicitly to surface problem areas rapidly, enabling teams to quickly pinpoint and diagnose issues across all telemetry signals, from traces and metrics to logs and profiles.
Odigos
Odigos is similar to Coroot, with a strong focus on automatic end-to-end distributed tracing using eBPF and OpenTelemetry. eBPF is proving to be an extremely effective tool for “almost turn-key” distributed tracing — who would have ever thought that possible?
- Odigos was one of the first to market with fully automated tracing using eBPF, and they were the donors of the initial framework for the OpenTelemetry Go Auto Instrumentation libraries.
- Dynamic Tracing is an exciting feature new that allows for payloads and metadata to be adjusted in real-time, bringing things like Kafka messages and SQL queries into the context of a distributed trace.
Which to Choose?
Choosing the right observability tool depends significantly on your organization’s unique context and requirements. While SaaS vendors offer ease and rapid deployment, open-source platforms provide greater flexibility, control, and long-term cost efficiency.
ClickHouse, with its powerful analytical capabilities, remains a versatile cornerstone whether you’re building your observability stack or leveraging an existing solution. Ultimately, the best observability solution is the one aligned with your team’s capabilities, your infrastructure needs, and your strategic goals.
I would love to hear more about your own observability journey in the Altinity DB Slack.
ClickHouse® is a registered trademark of ClickHouse, Inc.; Altinity is not affiliated with or associated with ClickHouse, Inc.