A ClickHouse® 25.8 Detective Story: High Memory Usage and How to Fix It
As a part of Altinity Stable Builds certification, we run them in our dev environments for several months. That helps us to find important problems before those builds reach our customers. When testing the upcoming 25.8 LTS release, we noticed weird OOM errors even on idle ClickHouse clusters. That led to an interesting discovery that we will share in this article.
Memory Limit Exception
The story began while doing routine checks on the release. Our QA team started to notice errors like this:
DB::Exception: (total) memory limit exceeded: would use 5.63 GiB (attempt to allocate chunk of 0.00 B bytes), current RSS: 1.70 GiB, maximum: 5.63 GiB. OvercommitTracker decision: Query was selected to stop by OvercommitTracker: While executing AggregatingTransform. (MEMORY_LIMIT_EXCEEDED)Checks were running on a small machine with 7GB of RAM that was idle. So it was surprising to see the memory limit exceptions. Looking in logs, we identified the suspect: the system.metric_log table. ClickHouse was complaining about memory usage trying to merge this table. However, it was not visible to users until they ran a query. The problem was easy to reproduce from a console:
OPTIMIZE TABLE system.metric_log FINAL;

[c9d66aa9f9d1] 2025.11.10 10:04:59.091067 [97] <Debug> MemoryTracker: Background process (mutate/merge) peak memory usage: 6.00 GiB.
So the high memory usage was driven by a system table! We started to dig deeper.
system.metric_log table
system.metric_log table is used to store the time series of ClickHouse internal metrics. It is convenient if one wants to plug dashboards directly to ClickHouse – no Prometheus is needed. The table structure is denormalized, so every metric is stored in a separate column. Here is output from SHOW CREATE TABLE:
CREATE TABLE system.metric_log
(
     `hostname` LowCardinality(String) COMMENT 'Hostname of the server executing the query.',
    `event_date` Date COMMENT 'Event date.',
    `event_time` DateTime COMMENT 'Event time.',
    `event_time_microseconds` DateTime64(6) COMMENT 'Event time with microseconds resolution.',
    `ProfileEvent_Query` UInt64 COMMENT 'Number of queries to be interpreted and potentially executed. Does not include queries that failed to parse or were rejected due to AST size limits, quota limits or limits on the number of simultaneously running queries. May include internal queries initiated by ClickHouse itself. Does not count subqueries.',
    `ProfileEvent_SelectQuery` UInt64 COMMENT 'Same as Query, but only for SELECT queries.',
    `ProfileEvent_InsertQuery` UInt64 COMMENT 'Same as Query, but only for INSERT queries.',
…
The output is truncated, because there are too many columns. How many metrics ClickHouse does expose? Apparently, a lot! We can quickly check it with a query:
select count() from system.columns where database = 'system' and table = 'metric_log'
┌─count()─┐
│    1417 │
└─────────┘
Fourteen hundred! This number has grown a lot over the last few years and keeps growing! See the chart below that shows the growth of number of columns since 23.8 ClickHouse version:

Looks like the recent increase from 1212 to 1417 was the straw that broke the camel’s back. But why is the high number of columns causing problems with the merge?
Horizontal vs Vertical Merges
We often imagine that the MergeTree table is the heart of ClickHouse. If so, merges are the heartbeats. The merge process combines new parts produced by inserts into bigger ones. ClickHouse supports two merge algorithms with several variations: Horizontal merge and Vertical merge.
Horizontal merge reads and merges all columns at once — meaning all files are opened simultaneously, and buffers are allocated for each column and each part.
Vertical merge processes columns in batches — first merging only columns from ORDER BY, then the rest one by one. This approach significantly reduces memory usage but slower.
On top of that, there are two different part formats: wide parts and compact parts. Those are merged differently.
Wide parts — each column is stored in a separate file (more efficient for large datasets).
Compact parts — all columns are stored in a single file (more efficient for small inserts).
The most memory intensive is horizontal merge of wide parts. ClickHouse needs at least 2MB for each column, and it doubles during the merge. This is what is happening with the metric_log table: 4MB x 1417 that gives us 6GB.
Let’s see what happens if we force vertical merge for the metric_log table:
ALTER TABLE system.metric_log MODIFY SETTING
    min_bytes_for_wide_part = 100,
    vertical_merge_algorithm_min_rows_to_activate = 1;

OPTIMIZE TABLE system.metric_log FINAL;

[c9d66aa9f9d1] 2025.11.10 10:06:14.575832 [97] <Debug> MemoryTracker: Background process (mutate/merge) peak memory usage: 13.98 MiB.
Memory usage dropped more than 400 times from 6GB to 14MB!!!
How To Fix It?
Now we know where the problem is, how can it be fixed? There are several ways to make ClickHouse and users happy again. Let’s describe some of them.
Disable metric_log
This can be done with a simple configuration snippet:
<metric_log remove="1"/>While it solves the problem the easiest way it may break some observability dashboards.
Change Thresholds for Wide Parts
Clickhouse has 4 different settings that control when wide parts are created and when vertical merge is used. The defaults are convoluted, since those use row count for vertical merges and part size in bytes for wide parts:
| Parameter | Value |
| vertica_merge_algorithm_min_rows_to_activate | 131072 |
| vertica_merge_algorithm_min_bytes_to_activate | 0 |
| min_byte_for_wide_part | 10485760 (10 MB) |
| min_rows_for_wide_part | 0 |
Here are three possible ways to make defaults better:
- Increase
min_bytes_for_wide_part. For example, set it to at least 2800 * 131072 ≈ 350 MB. This delays the switch to the wide format until vertical merges can also be used. - Switch to a row-based threshold by using
min_rows_for_wide_partinstead ofmin_bytes_for_wide_part. - Lower the threshold for vertical merges. Reduce
vertical_merge_algorithm_min_rows_to_activate, or setvertical_merge_algorithm_min_bytes_to_activate.
For example, metric_log can be changed as follows:
<metric_log replace="1">
    <database>system</database>
    <table>metric_log</table>
    <engine>
        ENGINE = MergeTree
        PARTITION BY (event_date)
        ORDER BY (event_time)
        TTL event_date + INTERVAL 14 DAY DELETE
        SETTINGS min_bytes_for_wide_part = 536870912;
    </engine>
    <flush_interval_milliseconds>7500</flush_interval_milliseconds>
</metric_log>
This configuration increases the threshold for wide parts to 512 MB, preventing premature switching to the wide format and reducing memory usage during merges.
We have submitted pull request #89811 to upstream ClickHouse with this change.
Change Server Defaults
It turns out that ClickHouse defaults are less than optimal not only for the metric_log table but all wide tables in general. So it makes sense to change defaults globally and align wide parts with vertical merges:
<clickhouse>
  <merge_tree>
    <min_bytes_for_wide_part>134217728</min_bytes_for_wide_part>
    <vertical_merge_algorithm_min_bytes_to_activate>134217728</vertical_merge_algorithm_min_bytes_to_activate>
  </merge_tree>
</clickhouse>
These settings tell ClickHouse to keep using compact parts longer and to enable the vertical merge algorithm simultaneously with the switch to the wide format, preventing sudden spikes in memory usage.
Normalize Table Structure
Here is an alternative way to fix the memory problem. Apparently, metric_log is unique in its design. Other log tables, e.g. asynchronous_metric_log have a different structure “vertical” structure, for example:
CREATE TABLE system.asynchronous_metric_log
(
    `hostname` LowCardinality(String) COMMENT 'Hostname of the server executing the query.' CODEC(ZSTD(1)),
    `event_date` Date COMMENT 'Event date.' CODEC(Delta(2), ZSTD(1)),
    `event_time` DateTime COMMENT 'Event time.' CODEC(Delta(4), ZSTD(1)),
    `metric` LowCardinality(String) COMMENT 'Metric name.' CODEC(ZSTD(1)),
    `value` Float64 COMMENT 'Metric value.' CODEC(ZSTD(3))
)
ENGINE = MergeTree
PARTITION BY toYYYYMM(event_date)
ORDER BY (metric, event_date, event_time)
SETTINGS index_granularity = 8192
As you can see, instead of a separate column for every metric, it uses a name/value approach. It reduces the number of columns at the expense of many more rows. The same structure can be adopted for the metric_log table as well. This functionality arrived in #78412 in 25.4:
<clickhouse>
    <metric_log>
        <database>system</database>
        <table>metric_log</table>
…
        <schema_type>transposed_with_wide_view</schema_type>
    </metric_log>
</clickhouse>
That would store actual data in a table transposed_metric_log with the transposed schema, and create a view metric_log on top of it using the wide schema that queries transposed_metric_log.
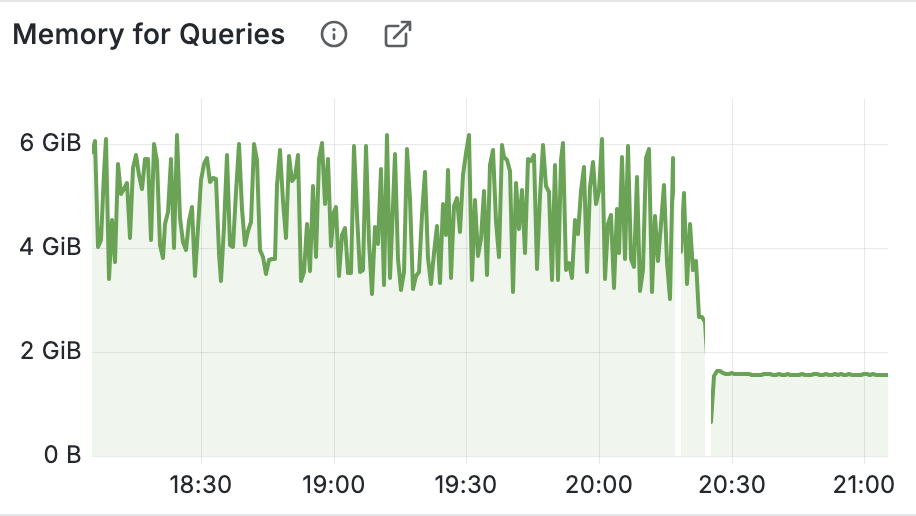
With any of those changes your ClickHouse RAM usage will drop back to a normal:
Conclusion
ClickHouse does a good job storing its own observability data. The latest versions have more than 100 system tables, of which 12 are “log” tables that store time series of internal metrics. The log tables help with monitoring and troubleshooting, but they do not come for free. We saw in the past that introducing new system monitoring tables added significant load and affected application performance. In 25.8 we discovered a high memory pressure from inefficient merges on a wide system table. While it is easy to fix, it requires planning and testing the upgrade carefully. See our ClickHouse Upgrade Cookbook for the comprehensive guide to ClickHouse upgrade process.
Meantime, we plan to release 25.8 Altinity Stable by the end of the year. It will be based on the 25.8 LTS upstream version with additional fixes plus all Antalya features! Stay tuned!
ClickHouse® is a registered trademark of ClickHouse, Inc.; Altinity is not affiliated with or associated with ClickHouse, Inc.