Use Altinity.Cloud to Simplify Your App with ClickHouse® Endpoints
The Altinity Cloud Manager (ACM) has a new feature in the Cluster Explorer that makes it easy to work with API Endpoints. An API endpoint lets you create a REST endpoint for a ClickHouse query. When an authorized user calls that endpoint, ClickHouse runs the query and returns the results. Simple and elegant.
The benefits of API endpoints
Without API endpoints, an app needs to include an SQL statement that looks like this:
SELECT
    countIf((hour(tpep_pickup_datetime) >= 16) AND
            (hour(tpep_pickup_datetime) < 20)) AS rush_hour_rides,
    count() AS total_rides,
    round((rush_hour_rides * 100.) / total_rides, 2) AS percentage
FROM demo.taxi_local
FORMAT JSON
We can create an endpoint named /rush-hour that takes two parameters (we’ll replace 16 and 20 in the SQL statement above with variables) and returns the result. Here’s how to run the same query through an API endpoint:
curl https://user:pwd@clickhouse_url:8443/rush-hour?start_time=16&end_time=20
With the API endpoint, the app’s code simply connects to a URL and processes the data it returns. An app developer doesn’t have to know anything about the structure of our database. (It’s possible we don’t want developers to know anything about the structure of our database anyway.) And if at any point we need to change our database’s schema, that’s completely transparent to whoever is using the API endpoint.
BTW, we used curl here, but all modern languages and frameworks have easy ways to open an endpoint and process the response. The sample application we’ll look at in this blog post uses the standard Fetch API, for example.
Our sample application
The sample application we’ll consider here is in the Altinity examples repo under the api-endpoints directory. We’ll set up a ClickHouse database that contains Yellow taxi data from the New York City Taxi & Limousine Commission dataset. For each Yellow taxi ride, we have data about where and when the ride started, where and when it ended, how many passengers were on each ride, the fare, the driver’s tip, and other data. We want to analyze that data, so we’ll create a web application that visualizes different queries for insights. That web application will use API endpoints to get the data it uses in its display.
The majority of the sample application was written interactively with Claude, which designed the web UI, built the queries behind the endpoints, assisted with debugging, and generated the first draft of the documentation. If you want to read more about our development process, jump ahead to the section Thanks, Claude! below or see the AGENTS.md file in the repo.
In this post we’ll go through these steps:
- Create a database and a couple of tables in our ClickHouse cluster. One table will contain the raw taxi data, the other will have the metadata that gives us the names of boroughs and pickup / dropoff locations.
- Load the Parquet files that contain Yellow taxi data from August through October of 2025.
- Use the ACM’s API endpoint manager to create three endpoints for three different queries. When an authorized application connects to one of those endpoints, ClickHouse executes the query and sends the results to the application.
- Configure and run a web app that visualizes data retrieved from the three endpoints. The web app lets users change the parameters for each query; whenever a parameter changes, the web app retrieves data from the endpoint again.
But first…
- If you don’t have an Altinity.Cloud account already, sign up for a free trial.
- Once you have an account, create a new ClickHouse cluster with two replicas.
Creating our sample database
No doubt you’re excited to create some endpoints, but first we’ll need a database and a couple of tables for the queries behind those endpoints. We’ll do that now. First, create the database:
CREATE DATABASE IF NOT EXISTS maddie ON CLUSTER '{cluster}';
With your database created, we’ll create the table that holds the taxi data:.
CREATE TABLE maddie.taxi_local ON CLUSTER '{cluster}'
(
    `VendorID` Nullable(Int32),
    `tpep_pickup_datetime` Nullable(DateTime64(6)),
    `tpep_dropoff_datetime` Nullable(DateTime64(6)),
    `passenger_count` Nullable(Int64),
    `trip_distance` Nullable(Float64),
    `RatecodeID` Nullable(Int64),
    `store_and_fwd_flag` Nullable(String),
    `PULocationID` Nullable(Int32),
    `DOLocationID` Nullable(Int32),
    `payment_type` Nullable(Int64),
    `fare_amount` Nullable(Float64),
    `extra` Nullable(Float64),
    `mta_tax` Nullable(Float64),
    `tip_amount` Nullable(Float64),
    `tolls_amount` Nullable(Float64),
    `improvement_surcharge` Nullable(Float64),
    `total_amount` Nullable(Float64),
    `congestion_surcharge` Nullable(Float64),
    `Airport_fee` Nullable(Float64),
    `cbd_congestion_fee` Nullable(Float64)
)
ENGINE = ReplicatedMergeTree('/clickhouse/{cluster}/tables/maddie/taxi_local', '{replica}')
ORDER BY tuple()
SETTINGS index_granularity = 8192;
The other table we need holds metadata about boroughs and locations. For example, the PULocationID might be 132; the metadata tells us that location is the JFK Airport in Queens. This command creates the table:
CREATE TABLE maddie.taxi_zones ON CLUSTER '{cluster}'
(
    `LocationID` Int32,
    `Borough` String,
    `Zone` String,
    `service_zone` String
)
ENGINE = ReplicatedMergeTree('/clickhouse/{cluster}/tables/maddie/taxi_zones', '{replica}')
ORDER BY LocationID
SETTINGS index_granularity = 8192;
Loading the taxi data
Now that we’ve got our database and tables defined, it’s time to load them with data. This statement uses ClickHouse’s url() function to load taxi data for August – October, 2025.
INSERT INTO maddie.taxi_local
SELECT * FROM url('https://d37ci6vzurychx.cloudfront.net/trip-data/yellow_tripdata_2025-{08,09,10}.parquet',
    'Parquet'
);
These files are quite large, so it will likely take several seconds to import the data. When it’s done, you should have roughly 12.25 million rows:SELECT count() FROM maddie.taxi_local;
┌──count()─┐
1. │ 12253805 │ -- 12.25 million
└──────────┘
Finally, we’ll import the metadata:
INSERT INTO maddie.taxi_zones
SELECT * FROM url(
    'https://d37ci6vzurychx.cloudfront.net/misc/taxi_zone_lookup.csv',
    'CSVWithNames'
);
As of this writing, the CSV file has 265 rows:
SELECT count() FROM maddie.taxi_zones;
   ┌─count()─┐
1. │     265 │
   └─────────┘
With our data in place, it’s time to create some endpoints!
Creating an endpoint in the ACM
The API Endpoints tab is in the ACM’s Cluster Explorer. We’ll look at the UI of the endpoint editor to show you how easy it is to work with endpoints. When you open the tab for the first time, you’ll see this:
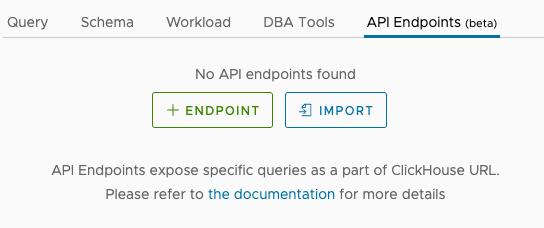
Clicking the + ENDPOINT button takes you to the endpoints editor:
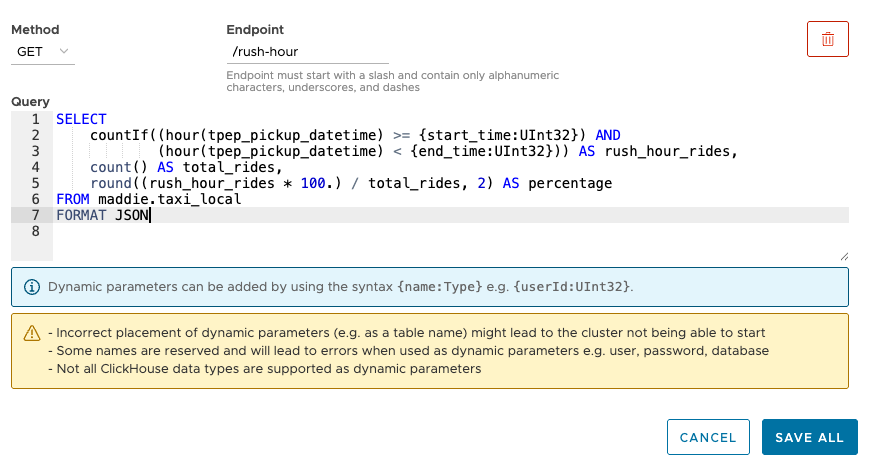
Select the GET method, name the endpoint /rush-hour, and paste this statement into the text box:SELECT
countIf((hour(tpep_pickup_datetime) >= {start_time:UInt32}) AND
(hour(tpep_pickup_datetime) < {end_time:UInt32})) AS rush_hour_rides,
count() AS total_rides,
round((rush_hour_rides * 100.) / total_rides, 2) AS percentage
FROM maddie.taxi_local
FORMAT JSON
Unlike the query at the start of this post, we now have two parameters, start_time and end_time, both of which are UInt32.
Click SAVE ALL and you’ll have an endpoint:

You’ll see a message that lets you know that the API endpoint isn’t fully configured inside ClickHouse:

When the message disappears, you’re ready to go. With the /rush-hour endpoint selected, the editor gives you entry fields for all of the parameters in the query. Here we can fill in values for start_time and end_time and run the query to make sure it works the way we want.
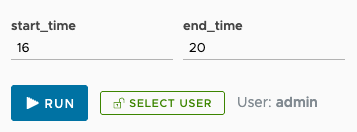
Enter some test values and click the RUN button. You should see the JSON results:
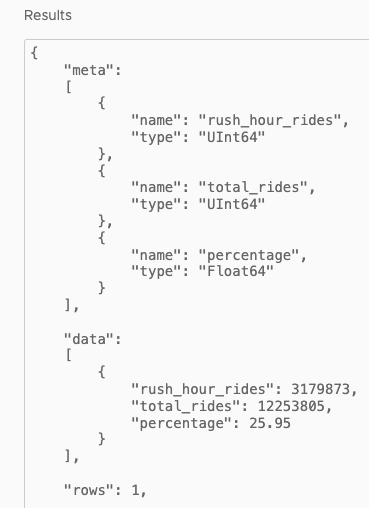
The JSON result includes the number of rides that occurred during the time interval we specified, the total number of rides through all hours of the day, and what percentage of rides happened during our time interval.
We can also choose to run the query as a particular user; that will be handy when we talk about access control later.
BTW, the ACM also supports the POST method, but that’s a subject for another blog.
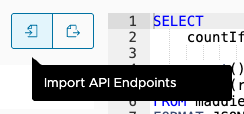
We’ve created an endpoint, but our web app visualizes three different queries. We’ll create all of them before we go on. Rather than create them separately, we can import a JSON file that defines a number of endpoints. That is extremely useful when we want to reuse endpoints in other clusters. Click the Import button:
The examples repo has the JSON file we want; copy and paste the text of the file https://raw.githubusercontent.com/Altinity/examples/refs/heads/main/api_endpoints/api-endpoints.json in the text field. Be aware that importing a set of endpoints replaces any existing endpoints.

Click the IMPORT button to create the three endpoints we need:
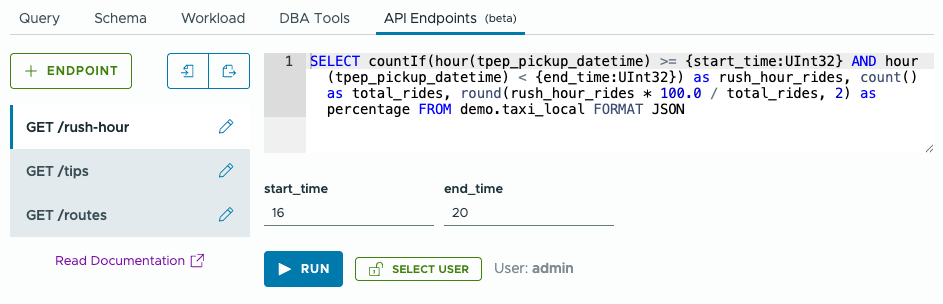
In this view, we have three endpoints: /rush-hour, /tips, and /routes, all of which are GET requests. The query for the /rush-hour endpoint is displayed. Because this query has parameters, we can enter values for them and run the query to make sure our endpoint is returning the right data.
Calling the endpoint
Before we get to our web app, we can test our endpoints with curl to make sure they work.
First of all, we need the URL of our ClickHouse cluster. There’s a Connection Details link in the ACM:
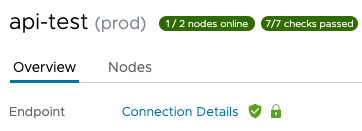
Clicking the link brings up this dialog:
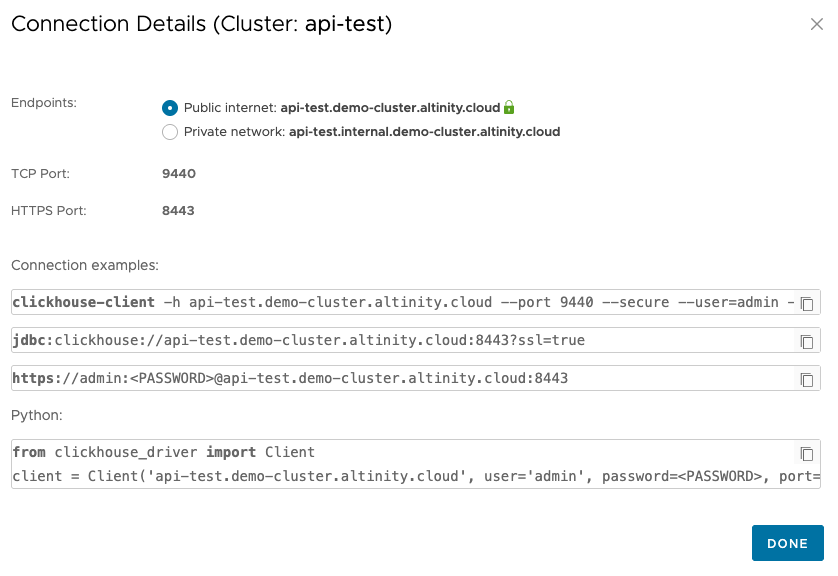
The URL is https://admin:<PASSWORD>@api-test.demo-cluster.altinity.cloud:8443. See the Cluster Connection Details documentation if you need more information. To test your endpoints, use your credentials and your cluster’s URL to run these curl commands:
curl https://admin:<PASSWORD>@api-test.demo-cluster.altinity.cloud:8443/rush-hour?start_time=16&end_time=20curl https://admin:<PASSWORD>@api-test.demo-cluster.altinity.cloud:8443/tips?min_distance=0&max_distance=5curl https://admin:<PASSWORD>@api-test.demo-cluster.altinity.cloud:8443/routes?borough=Manhattan&limit=10
You should get JSON data in response to all three curl commands. When you’re satisfied that the results are correct, it’s time to deploy our web app.
Our sample application
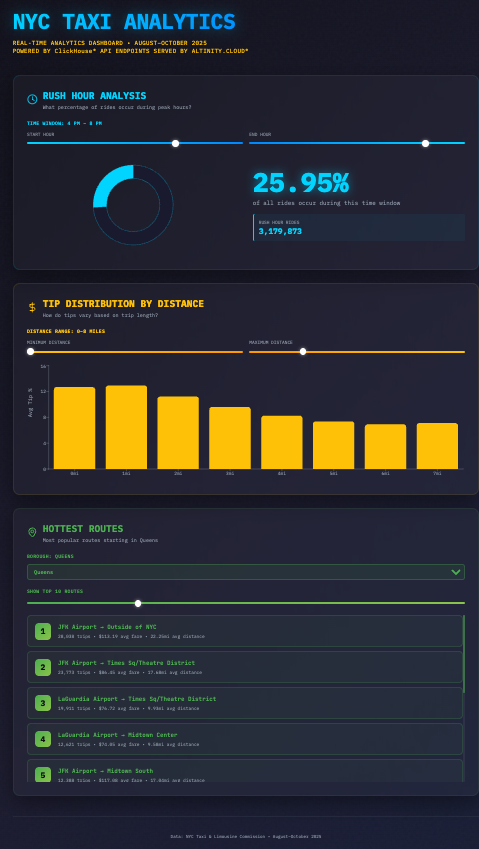
Our app has a React front end. As the user interacts with the controls on the page, the code calls the API endpoints we defined. We’ll look at three queries:
- Rush Hour analysis – Given a range of hours (4 pm to 8 pm, for example), what percentage of taxi rides occur during those times?

The underlying query here is/rush-hour?start_time=16&end_time=20.We’re looking at rides between 4 pm and 8 pm; just over a quarter of all rides happen between those times. There are sliders at the top of the pane. Whenever the user changes the start or end time, the web app calls the/rush-hourendpoint to get the data for the new values. The UI prevents the user from setting the start time to be equal to or greater than the end time. - Tip distribution by distance – How does the percentage tip given by the rider correlate to the distance of the ride?

The underlying query here is/tips?min_distance=0&max_distance=5. We’re looking at ride distances from 0 to 5 miles. The first column is rides less than one mile. Hovering over a column shows the data behind it. For rides between 1 and 2 miles (the second column above), the average tip is 13.67%:
As with the rush hour query, any changes to the sliders for minimum and maximum distance causes the web app to call the /tips endpoint again and update the graph. The UI prevents the user from setting the minimum distance to be equal to or greater than the maximum distance. - Hottest routes per borough – For a given borough, what are the most common routes? The API endpoint queries all rides that begin in the selected borough.

The underlying query is/routes?borough=Manhattan&limit=10.Here we’re looking at the ten most popular routes that start in Manhattan. (Scroll down to see the rest of the list.) Users can adjust the slider to view the top 5, 10, 15, 20, or 25 routes, and they can change the borough. Any change to the query parameters results in another call to the/routesendpoint. (Interesting fact: all of the top pickup locations in Queens are either the LaGuardia or JFK airports.)
Running the sample app
You can find the complete sample app in the Altinity examples repo. The files are in the api_endpoints directory; if you haven’t already, clone the repo and switch to that directory:
git clone https://github.com/Altinity/examples.git
cd examples/api_endpoints
Running the app is simple, but first we need to configure it with our cluster’s URL and our username / password.
First, configure the URL. The file vite.config.js has the following line; put your URL here.
target: 'https://mycluster.myenv.altinity.cloud:8443',
Now we need to set our credentials. Copy the file .env.example to .env, add your credentials, then save the file:
VITE_CLICKHOUSE_USERNAME=your_username_here
VITE_CLICKHOUSE_PASSWORD=your_password_here
The sample app creates a Basic Authentication header (Authentication: Basic Gtb3ZVVZXIZGVtz3B6hb3N3b3Jck) instead of putting the username and password in the URL.
Now we’re ready to run the app. Type docker compose up -d at the command line, then go to http://localhost:5173. You should see something like this:
(See the troubleshooting guide in the repo if you have any problems.)
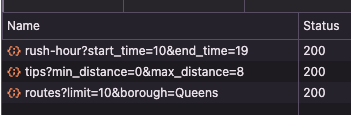
Play around with the parameters in each section. Whenever you change something, the app calls the endpoint and updates the display. Looking at the Network tab in the Chrome developer tools display, here are calls to all three of our endpoints:
Access control for your endpoint
One more thing before we go: you probably want tight control on who is allowed to see your data. There are a couple of things you should do to keep your data safe.
Define allowed IP addresses
The ACM lets you define a list of allowed IP addresses for your cluster. With those addresses defined, any request that comes from any other IP address will be ignored. Put the IP addresses of your authorized users on the list, and your endpoint is much more secure.
Create user accounts with limited access
You can only access the endpoints with valid credentials. You should create user accounts with limited access. The ACM makes it easy to manage your user accounts, and you can give those accounts read-only access to the databases you specify. And as we mentioned earlier, you can test the endpoints in the endpoint editor by running a query as a particular user.
Thanks, Claude!
The majority of the code and the design of the web UI were created by Claude. The AGENTS.md file in the sample code repo has the details, but the basic flow was something like this:
- I (your author) gave Claude the URL of the taxi dataset and asked Claude for a few queries that would make for interesting visualizations. I chose three of them.
- I created the API endpoints in the ACM and gave them to Claude. I asked Claude to create a modern, interactive web UI to visualize the results of the queries.
- I worked with Claude to enhance the queries (add the borough name to the Hottest Routes query, for example) and debug problems as I was getting everything running.
- One particularly thorny problem was that some versions of ClickHouse returned data as numbers, while other versions returned data as strings. The JSON data included
"rush_hour_rides" : 3179873in some cases and"rush_hour_rides": "3179873"in others. That took a while to figure out. The JavaScript code now uses theNumber()function to convert the data to a number. - Another headache came from using ClickHouse’s
s3()function to load the Parquet files of taxi data. We eventually switched tourl(), which is much simpler.
- One particularly thorny problem was that some versions of ClickHouse returned data as numbers, while other versions returned data as strings. The JSON data included
- I asked Claude to generate all of the typical documentation files (README.md, SETUP.md, and AGENTS.md), then rewrote and completed them.
- I tested the instructions more than a dozen times to make sure they were foolproof, recreating new ClickHouse clusters each time. (Claude doesn’t seem to realize how much work that is. Not that I’m bitter or anything.)
Summary
ClickHouse’s API endpoints simplify the code that goes into the applications that consume your data, hiding the structure of your database in the process. The Altinity Cloud Manager makes it easy to create, test, and manage endpoints, as well as manage users and control what they can access. With API endpoints, application developers access data in ClickHouse like any other REST endpoint. It’s a powerful, elegant way to deliver ClickHouse data and insights to your authorized users.
If you have questions please contact us at Altinity or join the discussion on our Slack channel. And please sign up for a free trial Altinity.Cloud account and try it out for yourself!
ClickHouse® is a registered trademark of ClickHouse, Inc.; Altinity is not affiliated with or associated with ClickHouse, Inc.