The True Value of Open Source Isn’t Just Code—It’s the Community
In light of the recent turbulence within the WordPress ecosystem and the broader discussions around license changes in various open-source projects, there’s something that needs to be said, even though it should be painfully obvious: The real value of any…
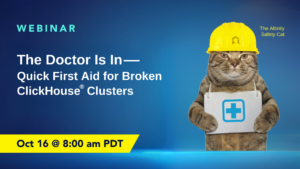
The Doctor Is In–Quick First Aid for Broken ClickHouse® Clusters
Properly managed ClickHouse servers are well-behaved, but every cluster runs into problems at some point. In this webinar, we’ll introduce common issues that require admin intervention or even application changes. Topics include too many connections, too many parts, lost replicas,…
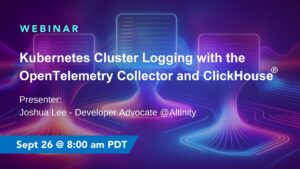
Kubernetes Cluster Logging with the OpenTelemetry Collector and ClickHouse®
Logs may be looked down upon by today’s observability thought leaders, but there is a reason they are the first pillar of observability: there’s a relevant log message at the end of almost every debugging journey! Collecting those logs from…
Learning to appreciate monotonic functions in ClickHouse®
Introduction ClickHouse has an amazing number of optimizations that enable it to fetch data quickly, often involving math concepts that don’t sound particularly interesting to most users. One such optimization involves monotonically increasing functions (say that five times fast). Deep…
How to Monitor Metrics and Logs From Altinity.Cloud in Grafana Cloud
With the Altinity Cloud Manager, it’s easy to use Grafana, Prometheus, and Loki to visualize ClickHouse clusters and the data they manage.
Kubernetes Cluster Logging with ClickHouse® and OpenTelemetry
In this post, we put together a working demo with the OpenTelemetry Collector gathering all logs from a Kubernetes Cluster and storing them in ClickHouse.


