
Star Schema Benchmark: ClickHouse® on Nirvana × Altinity
Note: This article was originally written by Nirvana Labs.
Earlier this week we announced that Nirvana is live on Altinity.Cloud as a BYOC option. This post is the receipts: we ran the Star Schema Benchmark on the joint stack to see what a single Altinity-managed ClickHouse node actually does on Nirvana infrastructure.
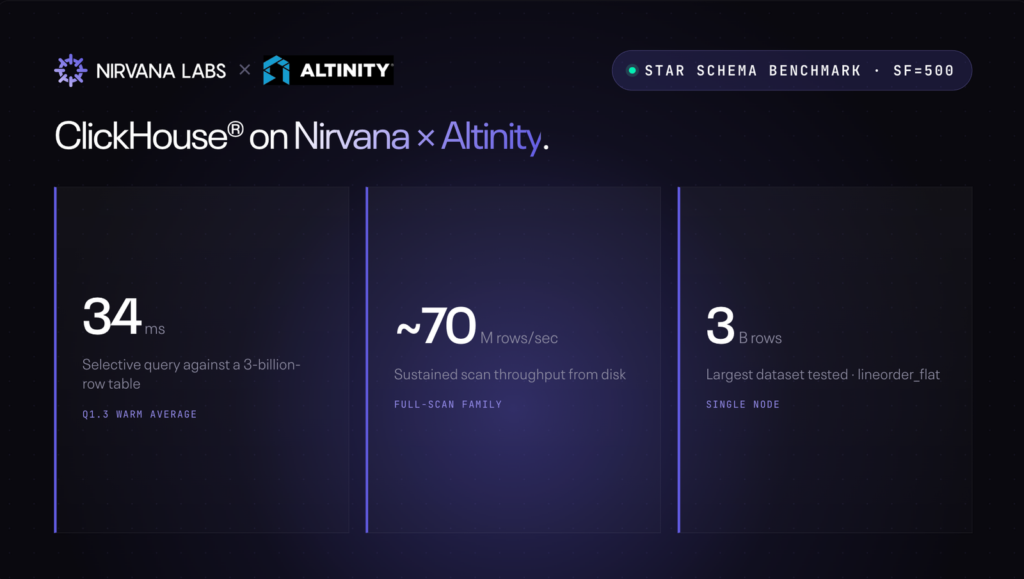
34 ms selective queries against a 3-billion-row table. ~70M rows/sec sustained on full scans from disk. On one node.
The Workload
The Star Schema Benchmark (SSB): 13 queries stressing scans, filters, aggregations, and joins against lineorder_flat, the canonical denormalized fact table. We ran it at two scale factors:
- SF=100: 600M rows. Fits in page cache. Measures the CPU-bound ceiling.
- SF=500: 3B rows. Exceeds RAM, so every run pulls cold blocks from disk. This is the production-realistic baseline, and the one to quote.
The Setup
Single-node ClickHouse 25.8.16, managed end-to-end by Altinity, running on Nirvana high-performance cloud.
| Cluster | nirvanalabs-o5nod.altinity.cloud |
| Engine | ClickHouse 25.8.16, single node |
| Storage | Two ~344 GiB volumes, JBOD policy |
| Table | lineorder_flat, partitioned by year, ordered by (LO_ORDERDATE, LO_ORDERKEY) |
| Operator | Altinity.Cloud, fully managed |
| Runs | 13 queries × 3 executions each: run 1 approximately cold, runs 2-3 warm |
Results: SF=500, 3 Billion Rows From Disk
Warm averages. Working set exceeds RAM, so even warm runs read from disk.
| Query | Class | Rows Read | Warm Avg |
|---|---|---|---|
| Q1.3 | Highly selective | 1.8M | 34 ms |
| Q3.4 | Index hit | 7.7M | 63 ms |
| Q1.2 | Partition-bounded | 7.8M | 110 ms |
| Q1.1 | Partition-bounded | 91M | 1.38 s |
| Q4.3 | Partition-bounded | 144M | 3.45 s |
| Q4.2 | Partition-bounded | 144M | 5.29 s |
| Q3.3 | Full scan | 547M | 24.3 s |
| Q3.2 | Full scan | 547M | 24.7 s |
| Q2.3 | Full scan | 600M | 27.1 s |
| Q2.2 | Full scan | 600M | 28.1 s |
| Q3.1 | Full scan | 547M | 31.0 s |
| Q2.1 | Full scan | 600M | 31.1 s |
| Q4.1 | Full scan | 600M | 43.8 s |
The shape to notice: queries that use the primary index and partition pruning answer in tens of milliseconds against 3B rows. Full scans settle into a predictable ~70M rows/sec from disk. Nothing in between falls off a cliff.
What We Learned
Selective queries are the strong signal. Q1.3 lands at 34 ms because a tight filter rides partition pruning and sort-key skipping: it reads 1.8M rows, not 3B. Q3.4 hits 63 ms the same way. This is the shape most production dashboards actually run, and it stayed interactive as the dataset grew 5x: latency grew only 2.8-3.9x.
Full-scan throughput is solid and predictable. Q4.1 reads 3B rows in 43.8 s warm, roughly 70M rows/sec sustained from disk, versus ~215M rows/sec from cache at SF=100. That ~3x gap between cached and disk-bound is the number to plan capacity against.
Performance is stable run to run. Q3.2 at 24.85 s, then 24.58 s. Q4.1 at 45.08 s, then 42.45 s. And with the working set past cache, the cold-to-warm ratio narrows to 1.0-1.1x: the first query of the day runs as fast as the hundredth.
On Comparisons
We are not publishing a comparison against other clouds here. A parity claim needs the same dataset and queries measured on both sides, and we have only run one side. If you want a comparison, the useful one is your own workload: bring your dataset and queries and we’ll measure them side by side.
Methodology
- Build
dbgen(vadimtk/ssb-dbgen) on the load host, generate and load all five base tables at each scale factor. - Build
lineorder_flat, the wide table all 13 queries hit. Validatecount(lineorder_flat) = count(lineorder)exactly before trusting any timing. - Run each query 3x back to back: run 1 approximately cold, runs 2-3 warm.
The full report includes a Remarks section covering what went wrong and what we’d do differently. If you’re reproducing this, read it first.
Read the Full Report
Interactive per-query breakdowns, both scale factors, full run log: Full report →
Want your workload measured on the joint stack? Talk to us →
For how ABS compares against AWS storage tiers directly, see our ClickBench results.
ClickHouse® is a registered trademark of ClickHouse, Inc.; Altinity is not affiliated with or associated with ClickHouse, Inc.