Introducing the Altinity Dashboard, a UI for the ClickHouse® Operator

The Altinity Dashboard is a new Altinity open source project aimed at making ClickHouse deployment in Kubernetes easy, painless and successful. It builds on our work already done in the ClickHouse Operator for Kubernetes.
Running ClickHouse Clusters on Kubernetes
ClickHouse can run just about anywhere, but we think it’s a good idea for most people to run it on Kubernetes, because it allows consistent and repeatable deployments to public cloud, private cloud, bare metal servers and your own laptop. The “lingua franca” of Kubernetes is the YAML manifest file. Once you have a manifest describing your environment, you can deploy it anywhere.
However, these manifests can be quite complicated. To fully deploy a ClickHouse cluster, you must describe the pods (using pod templates), the order in which the pods can launch (using stateful sets), the storage resources the database will use (using persistent volume claims), and the methods by which the system can be accessed over a network (using services and load balancers). Each of these top-level services has requirements of its own, so fully describing a moderately complex ClickHouse deployment might require several dozen individual entities.
ClickHouse Operator
To reduce the complexity of deploying ClickHouse in Kubernetes, we wrote the ClickHouse Operator. This allows you to write a higher-level YAML entity, describing your cluster much more succinctly than is possible with regular Kubernetes manifests. You can just say things like “replicas: 4,” and the operator will figure out what that means in terms of pods, stateful sets, load balancers and so on.
This is a big improvement, but you still need to deploy the operator itself, and you need to use command-line tools to apply and change the configuration of your cluster. Also, in order to know the status of your cluster, you still need to be familiar with the kinds of Kubernetes objects the operator is going to create. Can’t connect to ClickHouse? Maybe it’s because your pod is in a crash backoff loop, or maybe it’s because your service isn’t connecting.
We thought it would be easier if you had a dedicated UI where you could easily deploy the operator, deploy ClickHouse clusters, and then see what’s going on with them. So we wrote one!
Altinity Dashboard
The Altinity Dashboard aims to make ClickHouse deployment in Kubernetes easy, painless, and successful. It is open source (Apache 2.0 licensed), so you can use it without limitations. The project is on GitHub at https://github.com/altinity/altinity-dashboard. The README has detailed instructions on getting started, but the quick version is:
- Download the executable file for your platform (Windows, Mac or Linux) from the Releases page.
- On Unix-like platforms, `chmod 0755 adash` to make it executable.
- Run `adash –openbrowser`. It will start a web server and then launch your default web browser and connect to it.
The result should look like this:
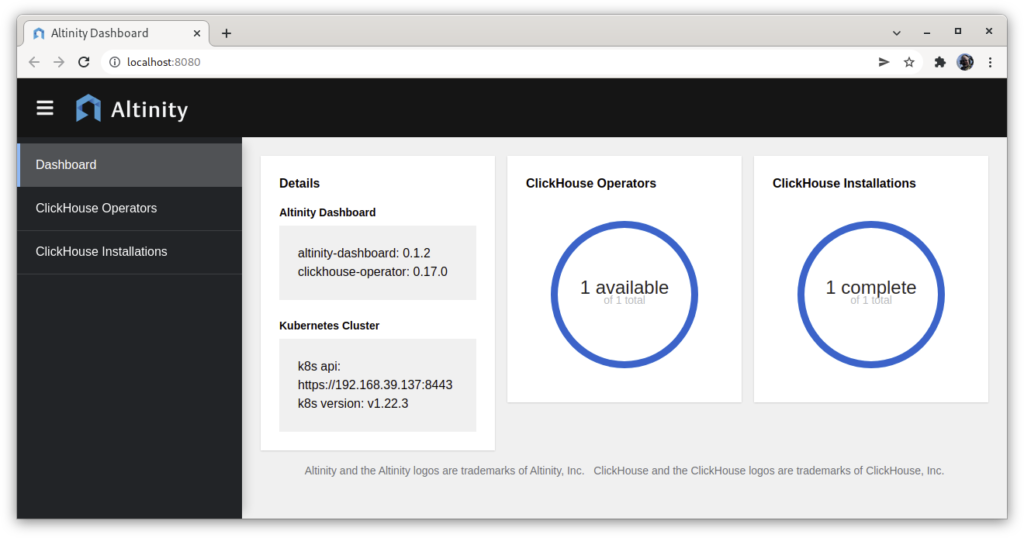
As of this writing, the current version is v0.1.1, which is considered pre-release and should not be relied on in production settings. We’re working on QA and new features, but you can try it out now.
You can run the dashboard in-cluster if you like, but we’ve been more focused on the out-of-cluster use case, where you run it on your own laptop or desktop. The only Kubernetes work you need to do is to have a Kubernetes cluster up and running somewhere (including locally via Minikube, k3s etc), and have a kubeconfig that allows you to connect to it. If your kubeconfig is in the default location, adash will find it; if not, you will need to supply the path to it using the `–kubeconfig` parameter.
Once the dashboard is running and connected to Kubernetes, you can use it to deploy clickhouse-operator, or upgrade to the latest version. To do this, go to the ClickHouse Operators page, and click the blue plus sign in the top right corner:
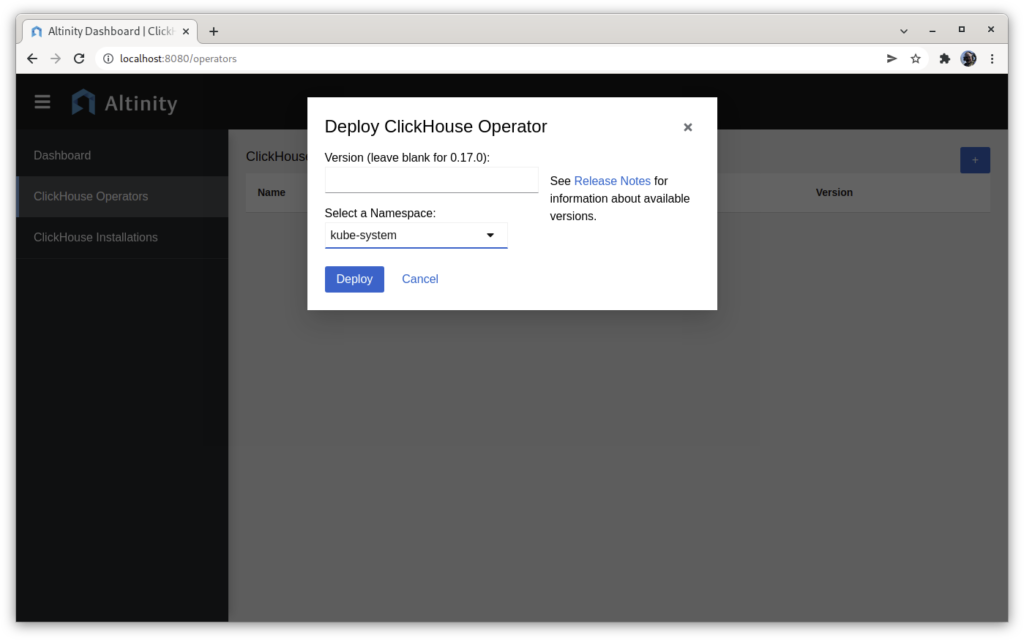
This screen allows you to deploy clickhouse-operator to your Kubernetes cluster. By default the current version will be selected, though you can override this if you prefer a different version. If you want the operator to monitor your whole Kubernetes environment, deploy it to the kube-system namespace; if you only want it to monitor a specific namespace, then deploy it where you want it to function. (A future version of Altinity Dashboard is planned to include the ability to create a namespace here, if you want to.)
Once the operator is deployed, you can see its details:
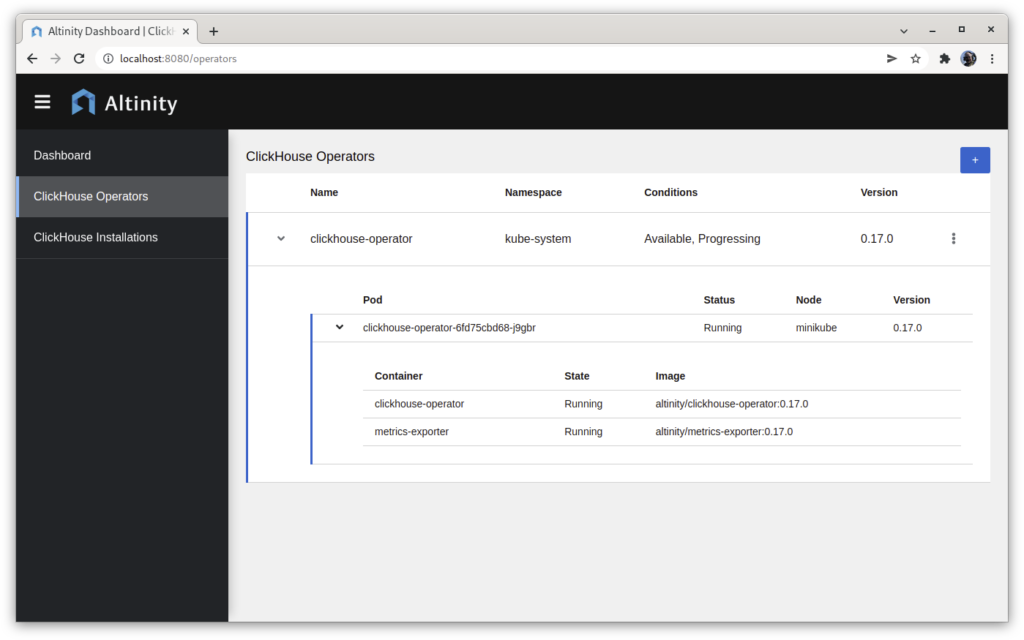
This shows that the operator is installed on the one and only node in my Minikube cluster, and that it is fully deployed and running.
Now that we’ve accomplished this, we can move on to deploying ClickHouse itself, via the ClickHouse Installations page. Just press the blue plus sign, also in the top right corner. It brings up the following screen.
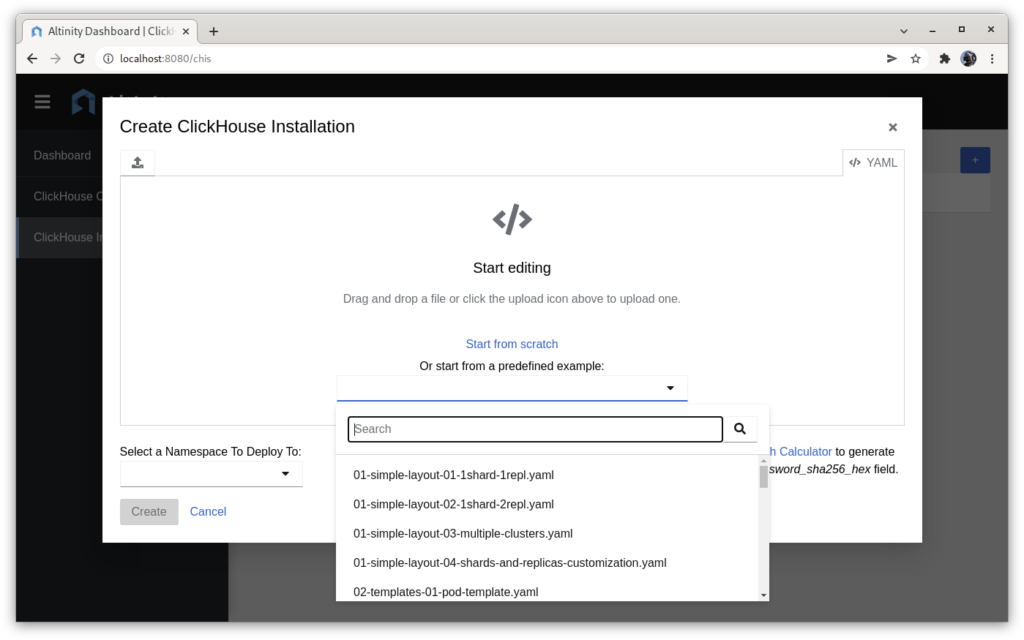
This page includes a built-in text editor for writing a ClickHouse Installation manifest. You can start from a blank file, but it’s usually easier to start from a working example and modify it to your needs. All the examples from the clickhouse-operator documentation are available within the app. There is also a link to the documentation, so you can easily find out what options are available in the YAML file and how to use them. Last but not least, there is a password hash generator, so you can add ClickHouse users with a sha-256 hash rather than by storing their plaintext password in the file.
For example, here is a very simple YAML manifest:
apiVersion: clickhouse.altinity.com/v1
kind: ClickHouseInstallation
metadata:
  name: "simple-01"
spec:
  configuration:
    users:
      user1/networks/ip: "::/0"
      user1/password_sha256_hex: 5e884898da28047151d0e56f8dc6292773603d0d6aabbdd62a11ef721d1542d8
      user1/profile: default
    clusters:
    - name: cls1
      layout:
        shardsCount: 1
        replicasCount: 1
This describes a single shard, single replica ClickHouse installation with a user named user1 whose password is `password`. When we submit this manifest by clicking Create, the dashboard sends it to the operator, which then begins building the cluster. You have visibility into this process through the UI, which shows the clusters, pods and storage deployed in your environment – in this case just a single pod. The UI also includes warnings when problems exist. The cluster we just created will give a warning, because we didn’t define any storage:
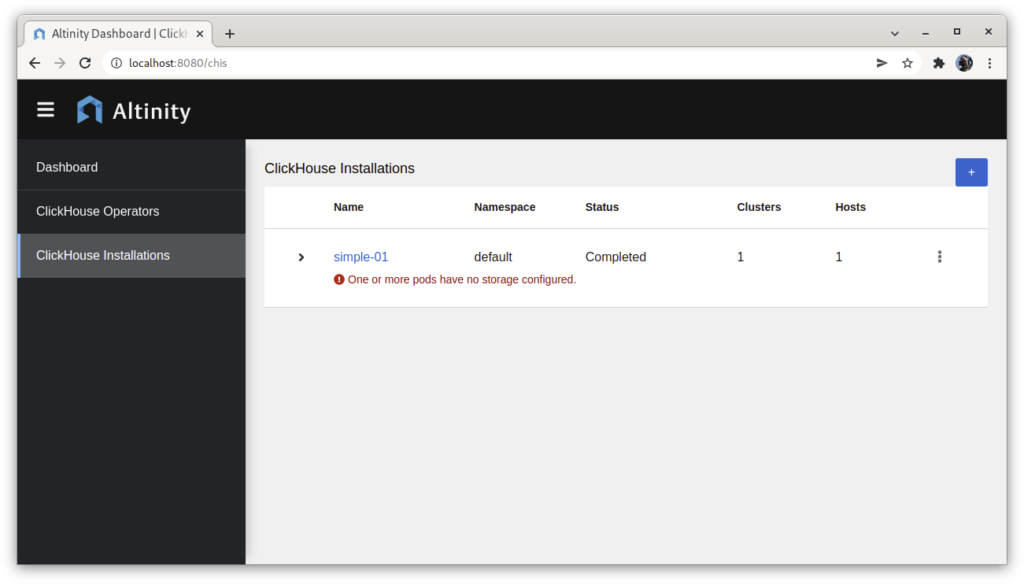
This cluster is using temporary storage, so all its data will be deleted if the pod is deleted. To fix this, we can deploy a new cluster with a configuration that includes storage:
apiVersion: "clickhouse.altinity.com/v1"
kind: "ClickHouseInstallation"
metadata:
  name: "simple-02"
spec:
  configuration:
    clusters:
      - name: "cl"
        layout:
          shardsCount: 1
          replicasCount: 1
        templates:
          volumeClaimTemplate: storage-vc-template
  templates:
    volumeClaimTemplates:
      - name: storage-vc-template
        spec:
          storageClassName: standard
          accessModes:
            - ReadWriteOnce
          resources:
            requests:
              storage: 1Gi
After deploying this configuration, we no longer get the warning, and we can drill down into the details of the installation and find that it does indeed have storage configured:
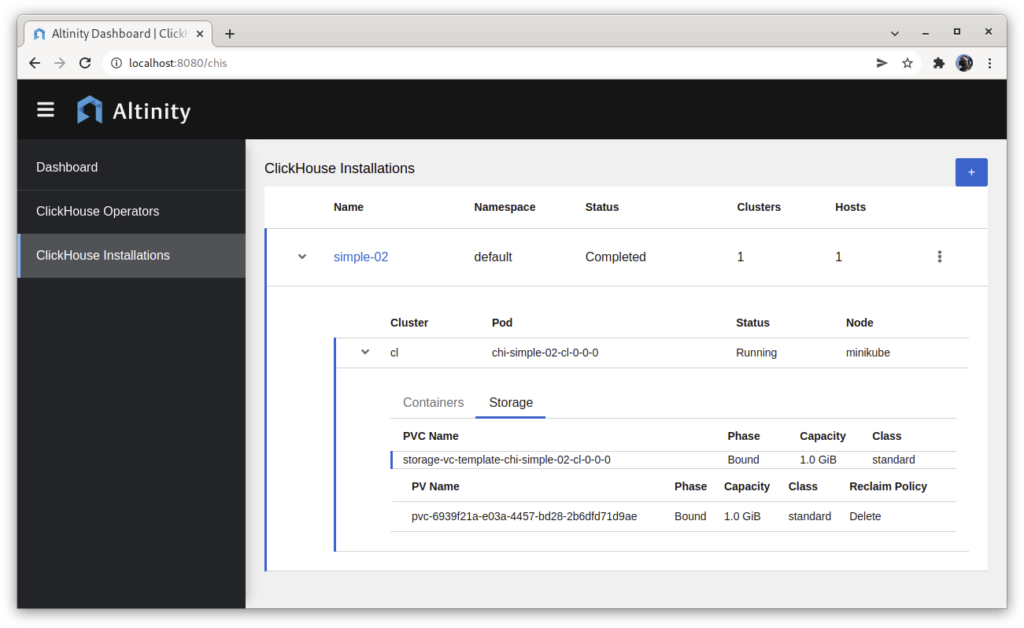
Many changes can be made without re-creating the cluster – for example, you can change the number of shards and replicas by clicking “Edit” and updating the YAML in place. For details on which items can be changed in a running cluster, see the clickhouse-operator documentation.
Future Directions
We have more features planned for adash – see the GitHub issues list for several of them. If you have ideas of where you’d like this to go or things you want to see, we encourage you to participate – open an issue, file a pull request, or chat with us on the #kubernetes channel on the AltinityDB Slack. Please don’t be shy. We are delighted to hear your ideas!
ClickHouse® is a registered trademark of ClickHouse, Inc.; Altinity is not affiliated with or associated with ClickHouse, Inc.