Unraveling the Mystery of Idle Threads in ClickHouse®

If you love ClickHouse®, Altinity can simplify your experience with our fully managed service in your cloud (BYOC) or our cloud and 24/7 expert support. Learn more.
Introduction: The Case of the Idle Threads
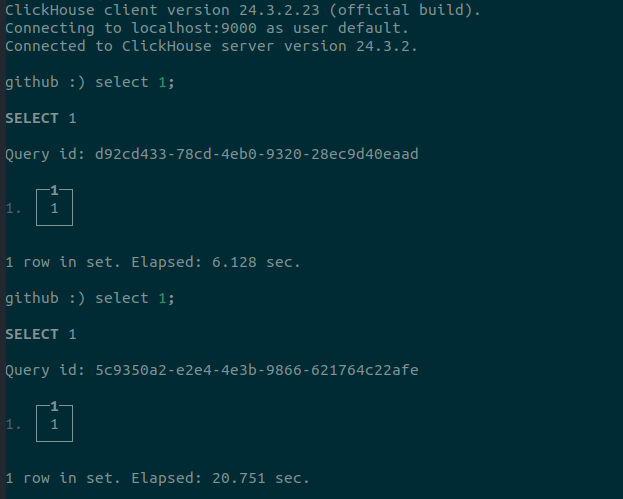
ClickHouse is renowned for its lightning-fast analytics and ability to handle large-scale queries. However, like any high-performance database, it can run into challenges under heavy workloads. Imagine running ClickHouse on a well-provisioned machine—ample cores, plenty of memory—only to notice that during peak loads, performance starts to degrade. You check the usual suspects: CPU, disk, network… and everything seems fine. Yet queries seem to “hang,” with even the simplest SELECT 1 taking as long as 10 seconds to execute. What’s going on?
This is the story of how we uncovered a performance bottleneck in ClickHouse’s thread pool, one that wasn’t immediately obvious. The root cause wasn’t high CPU usage or an overloaded network; it was something deeper, hidden in the way ClickHouse creates and manages threads under heavy load. What we found led to a significant performance improvement for highly concurrent environments and proved the importance of understanding kernel-level behavior in thread management.
In this article, we’ll take you on a journey through the debugging process, the surprising discoveries we made, and the eventual fix that improved ClickHouse’s performance by over 10% in certain workloads. It’s a story for Linux geeks, ClickHouse power users, and developers who love diving deep into performance mysteries.
If you feel that this article is too low-level for you, feel free to skip ahead to the section “Practical Recommendations for End Users“.
A special thanks to Azat Khuzhin (GitHub) and Ilya Golshtein (GitHub) for their invaluable advice and help during debugging. Both not only assisted with debugging but also contributed to the code fixes. Huge kudos to Shenghao Yang for gathering critical debug data from the Linux kernel, and to Sergei Trifonov (GitHub) from the ClickHouse core team for reviewing the solution.
The Mysterious Slowdown: Symptoms and First Clues
It all started with a ClickHouse cluster exhibiting strange behavior. Under a typical workload, we suddenly saw the Load Average skyrocket (to thousands) while the CPU usage remained oddly low (like 70%). This is a classic symptom of some sort of bottleneck that’s not directly related to CPU or disk I/O—something was making the system wait.
SELECT
    event_time,
    metric,
    value
FROM system.asynchronous_metric_log
WHERE event_time BETWEEN '2024-04-08 20:30:30' AND '2024-04-08 20:38:30'
AND metric ILIKE '%Load%1'
ORDER BY event_time ASC

┌──────────event_time─┬─metric───────┬───value─┐
│ 2024-04-08 20:30:37 │ LoadAverage1 │    0.87 │
│ 2024-04-08 20:31:22 │ LoadAverage1 │   78.32 │ <-- Problem begins here, ClickHouse stops responding
│ 2024-04-08 20:32:23 │ LoadAverage1 │ 1199.17 │
│ 2024-04-08 20:33:37 │ LoadAverage1 │ 1867.00 │
│ 2024-04-08 20:37:39 │ LoadAverage1 │ 3272.61 │ <-- Final load spike before ClickHouse restart
SELECT
event_time,
round((1 - value) * 100, 2) AS cpu_usage
FROM system.asynchronous_metric_log
WHERE event_time BETWEEN '2024-04-08 20:30:30' AND '2024-04-08 20:38:30'
AND metric = 'OSIdleTimeNormalized'
ORDER BY event_time ASC
┌──────────event_time─┬─cpu_usage─┐
│ 2024-04-08 20:31:22 │ 62.1 │ <-- CPU usage spikes to only 62%, despite the high load
│ 2024-04-08 20:33:53 │ 52.0 │
│ 2024-04-08 20:35:08 │ 58.2 │
│ 2024-04-08 20:37:39 │ 48.9 │This unusual pattern—high system load but low CPU utilization—suggests that something other than CPU was the bottleneck, potentially related to thread contention, lock waits, or inefficient resource management, all while the system seemed to be doing very little work.
At first glance, it seemed like the system wasn’t overloaded at all. Despite a massive Load Average, CPUIdle remained high, and all commands outside of ClickHouse were working normally. However, within ClickHouse, even monitoring queries were taking an abnormally long time to execute. This wasn’t just an isolated blip; the state persisted for minutes, during which a simple query like SELECT 1—normally lightning-fast—was now taking 5 to 30 seconds to return.
During that time, we saw an accumulation of many queries, all working very slowly together.
SELECT
    toStartOfInterval(event_time, toIntervalSecond(15)) AS t,
    sum(ProfileEvent_Query) AS queries_started,
    max(CurrentMetric_Query) AS queries_running
FROM system.metric_log
WHERE event_time BETWEEN '2024-04-08 20:30:30' AND '2024-04-08 20:38:30'
GROUP BY t
ORDER BY t ASC

┌───────────────t─────┬─queries_started─┬─queries_running─┐
│ 2024-04-08 20:30:30 │              46 │               1 │
│ 2024-04-08 20:30:45 │              65 │               1 │
│ 2024-04-08 20:31:00 │             502 │             465 │  <-- Spike begins
│ 2024-04-08 20:31:15 │             436 │             892 │  <-- More queries piled up
│ 2024-04-08 20:32:00 │               9 │             896 │
│ 2024-04-08 20:33:00 │               8 │             894 │
│ 2024-04-08 20:34:00 │               6 │             896 │
│ 2024-04-08 20:35:00 │               3 │             903 │
│ 2024-04-08 20:36:00 │              12 │             909 │
│ 2024-04-08 20:37:00 │              63 │             973 │  <-- Running queries peak
│ 2024-04-08 20:37:30 │               0 │            1000 │  <-- Maximum concurrent load
└─────────────────────┴─────────────────┴─────────────────┘
This shows the rapid accumulation of running queries, with over 500 starting in just a few seconds, leading to a load peak where 1,000 queries were active simultaneously.
High concurrency and a lot of simultaneous queries explained the load average to some extent, but not why ClickHouse felt like it was turning into molasses.
As usual, we began debugging by examining the query_log and ProfileEvents, but they didn’t provide any immediate clues. At first glance, everything appeared normal. We even compared two identical simple queries—one executed during the slowdown and one outside of it—and all the metrics were nearly identical, except for the significantly different wall clock times.
/* A modified version of a query by Alexey Milovidov (ClickHouse Inc.). */

WITH
    query_id = 'b48de378-59b6-4ad2-af07-d9c1533b2569' AS first,
    query_id = '88c0e1c3-12db-4e18-b8c4-74aaf95780a3' AS second,
    arrayConcat(mapKeys(ProfileEvents), ['query_duration_ms', 'read_rows', 'read_bytes', 'written_rows', 'written_bytes', 'result_rows', 'result_bytes', 'memory_usage', 'normalized_query_hash', 'query_cache_usage']) AS metrics,
    arrayConcat(mapValues(ProfileEvents), [query_duration_ms, read_rows, read_bytes, written_rows, written_bytes, result_rows, result_bytes, memory_usage, normalized_query_hash, toUInt64(query_cache_usage)]) AS metrics_values
SELECT
    metrics[i] AS metric,
    anyIf(metrics_values[i], first) AS v1,
    anyIf(metrics_values[i], second) AS v2,
    formatReadableQuantity(v1 - v2) AS diff
FROM system.query_log
ARRAY JOIN arrayEnumerate(metrics) AS i
WHERE (first OR second) AND (type = 2) AND (event_time >= '2024-04-08 20:20:15') AND (event_time <= '2024-04-08 20:39:00')
GROUP BY metric
HAVING v1 != v2
ORDER BY
    (v2 - v1) / (v1 + v2) DESC,
    v2 DESC,
    metric ASC

┌─metric────────────────────────────┬───────v1─┬────v2─┬─diff────────────┐
│ SoftPageFaults                    │        0 │     7 │ -7.00           │
│ result_bytes                      │     1712 │ 17408 │ -15.70 thousand │
│ UserTimeMicroseconds              │      213 │  1105 │ -892.00         │
│ ContextLock                       │       17 │    18 │ -1.00           │
│ OSReadChars                       │      927 │   911 │ 16.00           │
│ result_rows                       │        3 │     2 │ 1.00            │
│ NetworkSendBytes                  │     5383 │  1535 │ 3.85 thousand   │
│ OSCPUVirtualTimeMicroseconds      │     7928 │  1571 │ 6.36 thousand   │
│ NetworkSendElapsedMicroseconds    │      865 │   106 │ 759.00          │
│ SystemTimeMicroseconds            │     7735 │   465 │ 7.27 thousand   │
│ SelectedRows                      │       34 │     2 │ 32.00           │
│ read_rows                         │       34 │     2 │ 32.00           │
│ SelectedBytes                     │    10923 │   636 │ 10.29 thousand  │
│ read_bytes                        │    10923 │   636 │ 10.29 thousand  │
│ OSWriteChars                      │     1776 │     8 │ 1.77 thousand   │
│ RealTimeMicroseconds              │ 24007496 │  1867 │ 24.01 million   │
│ query_duration_ms                 │    24007 │     1 │ 24.01 thousand  │
│ CannotWriteToWriteBufferDiscard   │       23 │     0 │ 23.00           │
│ NetworkReceiveElapsedMicroseconds │       57 │     0 │ 57.00           │
│ OSCPUWaitMicroseconds             │    19626 │     0 │ 19.63 thousand  │
│ QueryProfilerRuns                 │       24 │     0 │ 24.00           │
└───────────────────────────────────┴──────────┴───────┴─────────────────┘
Since this occurred on bare-metal instances, there was no question of resource bursting. There were no obvious spikes in memory usage or disk I/O. The real mystery was that while ClickHouse started handling a large number of queries, it would suddenly slow down dramatically, even though the system itself appeared deceptively underutilized.
The ThreadPool Bottleneck?
One of the key indicators of this issue was its correlation with the rapid growth of the global thread pool. Interestingly, this expansion often occurred despite a large number of idle threads already available. ClickHouse was spawning more and more threads, even though many existing ones were not assigned any work. For instance, at one point, there were already 4.7K threads created, but only 3.2K were actively engaged in tasks—yet new threads continued to be started. This raised a crucial question: Was this behavior the root cause of the slowdown, or merely a symptom of a deeper problem?
SELECT
    now(),
    metric,
    value,
    description
FROM system.metrics
WHERE metric LIKE 'GlobalThread%' OR metric = 'Query'
FORMAT Pretty;

┌─────────────────────now()─┬─metric────────────────┬─value─┬─description─────────────────────────────────────────────┐
│ 2024-04-08 20:35:15 │ Query                 │   544 │ Number of executing queries                             │
│ 2024-04-08 20:35:15 │ GlobalThread          │  4718 │ Number of threads in global thread pool.                │
│ 2024-04-08 20:35:15 │ GlobalThreadActive    │  3069 │ Number of threads in global thread pool running a task. │
│ 2024-04-08 20:35:15 │ GlobalThreadScheduled │  3224 │ Number of queued or active jobs in global thread pool.  │
└─────────────────────┴───────────────────────┴───────┴─────────────────────────────────────────────────────────┘
Digging Deeper…
Thanks to ClickHouse’s philosophy of “always-on debugging,” we can dive deeper into performance issues without needing special debug builds. The system includes the system.trace_log table, which logs stack traces of queries that run longer than one second, making it easier to pinpoint performance bottlenecks in real-time.
Let’s take a look at where ClickHouse spent the most time during the problematic period:
SELECT
    arrayStringConcat(arrayMap(x -> demangle(addressToSymbol(x)), trace), '\n') AS trace_functions,
    count()
FROM system.trace_log
WHERE (event_time >= '2024-04-08 20:31:15') AND (event_time <= '2024-04-08 20:38:00')
GROUP BY trace_functions
ORDER BY count() DESC
SETTINGS allow_introspection_functions = 1
The full trace results can be seen here. In summary, while the first two items—disk reading and related operations—are expected and normal for heavy data queries, the third finding stands out: Thread Pool Lock Contention. Adding tasks to the global thread pool, a process that should be nearly instant, was taking a significant amount of time, almost as much as disk I/O. This indicates that something unusual was happening with the thread pool, where delays in task scheduling and thread management were far more significant than they should have been.
We can also look closer at some queries which were expected to be instant but ran longer. If they ran for more than a second, they should appear in the system.trace_log. Let’s take a look:
WITH arrayStringConcat(arrayMap(x -> demangle(addressToSymbol(x)), trace), '\n') AS trace_functions
SELECT
    trace_functions,
    count()
FROM system.trace_log
WHERE ((event_time >= '2024-04-08 20:31:15') AND (event_time <= '2024-04-08 20:38:00')) AND (query_id IN (
    SELECT query_id
    FROM system.query_log
    WHERE ((event_time >= '2024-04-08 20:31:15') AND (event_time <= '2024-04-08 20:38:00')) AND (normalized_query_hash = 17791064728738142635)
))
GROUP BY trace_functions
ORDER BY count() DESC
LIMIT 300
SETTINGS allow_introspection_functions = 1
FORMAT Vertical

Row 1:
──────
trace_functions: __lll_lock_wait
__pthread_mutex_lock
void ThreadPoolImpl<std::__1::thread>::scheduleImpl<void>(std::__1::function<void ()>, Priority, std::__1::optional<unsigned long>, bool)
DB::PullingAsyncPipelineExecutor::pull(DB::Chunk&, unsigned long)
DB::PullingAsyncPipelineExecutor::pull(DB::Block&, unsigned long)
DB::TCPHandler::runImpl()
DB::TCPHandler::run()
Poco::Net::TCPServerConnection::start()
Poco::Net::TCPServerDispatcher::run()
Poco::PooledThread::run()
Poco::ThreadImpl::runnableEntry(void*)
start_thread

count():         8

Row 2:
──────
trace_functions:
__pthread_create_2_1
void ThreadPoolImpl<std::__1::thread>::scheduleImpl<void>(std::__1::function<void ()>, Priority, std::__1::optional<unsigned long>, bool)
DB::PullingAsyncPipelineExecutor::pull(DB::Chunk&, unsigned long)
DB::PullingAsyncPipelineExecutor::pull(DB::Block&, unsigned long)
DB::TCPHandler::runImpl()
DB::TCPHandler::run()
Poco::Net::TCPServerConnection::start()
Poco::Net::TCPServerDispatcher::run()
Poco::PooledThread::run()
Poco::ThreadImpl::runnableEntry(void*)
start_thread

count():         1
And we see here the same picture again—threads stuck waiting on locks (__lll_lock_wait, __pthread_mutex_lock) when adding tasks to the ThreadPool. These delays occurred within the scheduleImpl function, which is responsible for managing tasks in the thread pool. The second trace reveals another thread creation event (__pthread_create_2_1), further hinting at thread pool contention being the core issue and showing the exact place where the lock is held.
The __lll_lock_wait and pthread_mutex_lock lines indicated that numerous threads were stalled, waiting to acquire a lock inside scheduleImpl. This prevented new tasks from being scheduled and executed, leading to CPU underutilization despite high system load.
Diagnosing Thread Creation Delays with New Thread Pool Metrics
By analyzing the source code of the thread pool, we identified only one place where a lock was held during an ‘external’ operation—thread creation, which we occasionally observed in the stack traces (as shown in the example above).
But could this really be the cause? Why would thread creation be slow when, in synthetic tests, we can start hundreds of thousands of threads per second? Was the thread pool actually spending time on locks? And is there a correlation between these slowdowns and thread pool behavior?
To get direct answers to these questions, we needed more instrumentation—measuring time and counting events—to improve visibility into the thread pool’s internal workings. While some metrics were already available, they didn’t provide enough insight into the bottlenecks we encountered, particularly around thread creation delays and lock contention.
To address this, we introduced a new set of metrics that provide deeper introspection into the performance and behavior of ClickHouse’s thread pools. These metrics will also be essential to measure the eventual improvements in thread pool behavior. These changes, made possible because ClickHouse is open source, were part of PR #68674, aimed at offering more detailed visibility into how the thread pool operates under load. These new metrics are available starting from version 24.9.
Key Metrics Added
Several new metrics were introduced to help track thread pool performance:
- GlobalThreadPoolThreadCreationMicroseconds: Measures the time taken to create new threads. This metric is essential for identifying when thread creation becomes a potential bottleneck, allowing deeper investigation into delays during thread pool scaling.
- GlobalThreadPoolExpansions and Shrinks: These metrics track how often the global thread pool expands or shrinks, giving an indication of how well ClickHouse is adapting to the current workload.
- GlobalThreadPoolJobs and LocalThreadPoolJobs: Track the number of jobs processed by both global and local thread pools, offering insights into workload distribution.
- GlobalThreadPoolJobWaitTimeMicroseconds and LocalThreadPoolJobWaitTimeMicroseconds: These metrics track how long jobs sit in the thread pool queue before they are executed, highlighting any delays in task scheduling.
- GlobalThreadPoolLockWaitMicroseconds and LocalThreadPoolLockWaitMicroseconds: These metrics measure the time threads spend waiting for locks, helping identify where lock contention may be causing delays.
Here is an example query that shows how these metrics can be used to analyze the performance of the thread pool:
SELECT
    sum(ProfileEvent_GlobalThreadPoolExpansions),
    sum(ProfileEvent_GlobalThreadPoolShrinks),
    sum(ProfileEvent_GlobalThreadPoolThreadCreationMicroseconds),
    sum(ProfileEvent_GlobalThreadPoolLockWaitMicroseconds),
    sum(ProfileEvent_GlobalThreadPoolJobs),
    sum(ProfileEvent_GlobalThreadPoolJobWaitTimeMicroseconds),
    sum(ProfileEvent_LocalThreadPoolExpansions),
    sum(ProfileEvent_LocalThreadPoolShrinks),
    sum(ProfileEvent_LocalThreadPoolThreadCreationMicroseconds),
    sum(ProfileEvent_LocalThreadPoolLockWaitMicroseconds),
    sum(ProfileEvent_LocalThreadPoolJobs),
    sum(ProfileEvent_LocalThreadPoolBusyMicroseconds),
    sum(ProfileEvent_LocalThreadPoolJobWaitTimeMicroseconds)
FROM system.metric_log
WHERE event_time >= now() - INTERVAL 10 MINUTE;
This query can give an immediate sense of how many jobs are being processed by the thread pool, how much time is being wasted in locks, and whether thread creation is a bottleneck.
Example Output
Here’s an example of the new metrics in action, captured during a synthetic high-load test:
sum(ProfileEvent_GlobalThreadPoolExpansions):                          4,132
sum(ProfileEvent_GlobalThreadPoolShrinks):                             3,649
sum(ProfileEvent_GlobalThreadPoolThreadCreationMicroseconds):     15,043,940
sum(ProfileEvent_GlobalThreadPoolLockWaitMicroseconds):       21,807,528,619
sum(ProfileEvent_GlobalThreadPoolJobs):                               84,616
sum(ProfileEvent_GlobalThreadPoolJobWaitTimeMicroseconds):     1,787,436,966
sum(ProfileEvent_LocalThreadPoolExpansions):                          40,452
sum(ProfileEvent_LocalThreadPoolShrinks):                             40,452
sum(ProfileEvent_LocalThreadPoolThreadCreationMicroseconds):   3,895,767,384
sum(ProfileEvent_LocalThreadPoolLockWaitMicroseconds):        12,982,962,008
sum(ProfileEvent_LocalThreadPoolJobs):                                42,925
sum(ProfileEvent_LocalThreadPoolBusyMicroseconds):            16,998,330,672
sum(ProfileEvent_LocalThreadPoolJobWaitTimeMicroseconds):     13,590,969,274
With these metrics, we could finally quantify the problems we were observing.
We can see that the creation of 4,132 threads took more than 15 seconds in total (15,043,940 microseconds), and the lock waiting time in the global pool was approximately 21,807 seconds (21,807,528,619 microseconds)—that is, about 6 hours! If we divide 21,807 seconds by 15 seconds, we find that on average, about 1,450 threads were waiting for the lock while a thread was being created.
Additionally, the local thread pools’ efficiency in this scenario was alarmingly low. The ratio of LocalThreadPoolJobWaitTime to LocalThreadPoolBusy was approximately 45% to 55%. This means that of the total time from when a job was scheduled until it was completed, only 55% was spent on actual work, while a staggering 45% was overhead in the thread pool. Jobs were languishing in the queue for far too long, and the sluggish thread creation process was severely hampering overall system performance.
Why was Thread Creation so slow?
After gaining insights through the newly introduced metrics, it became clear that thread creation delays and lock contention were major contributors to the performance bottlenecks we were seeing. However, to get to the root of the problem, we had to dig deeper into low-level system behavior, especially around kernel-level locks and memory operations.
That required more low-level, kernel-side debugging techniques.
Capturing Thread Creation Timings with eBPF
One of the most useful tools for debugging thread pool performance is eBPF (Extended Berkeley Packet Filter), which allows us to trace system calls and capture stack traces for deeper analysis. By tracing pthread_create() calls, we were able to collect detailed information about thread creation latencies and stack traces showing where time was being spent in the kernel.
We used bpftrace to capture thread creation timings:
uprobe:/usr/lib64/libpthread.so:pthread_create /pid == $pid/ {
    @start[tid] = nsecs;
}

uretprobe:/usr/lib64/libpthread.so:pthread_create /pid == $pid/ {
    if (@start[tid] != 0) {
        printf("Thread creation latency: %d ns, map_count=%d\n", nsecs - @start[tid], curtask->mm->map_count);
        @start[tid] = 0;
    }
}
This script measures the latency of each pthread_create() call and shows the number of memory maps (map_count) in the system at the time of thread creation. In our case, we observed that thread creation latencies were sometimes as high as several hundred milliseconds, particularly when the system was under load.
Example output:
Thread creation latency: 450000000 ns, map_count=37129
Thread creation latency: 375000000 ns, map_count=37133
Thread creation latency: 64000000 ns, map_count=37137
Investigating mmap Semaphore Contention
Thread creation wasn’t just slow because of the number of threads being spawned—it was also getting blocked by a kernel-level lock, specifically the mmap_sem semaphore used for memory mappings (in newer kernel versions (5.8+), it was replaced with mmap_lock). This semaphore is used to protect access to memory maps, which the kernel needs to manipulate when creating a thread stack.
Using eBPF, we traced the mmap semaphore contention by tracking when threads were waiting on it:
tracepoint:syscalls:sys_enter_mmap {
    printf("Thread %d waiting on mmap_sem\n", pid);
}
The results showed that threads were spending a significant amount of time waiting for the mmap semaphore, particularly during thread creation when the system had to allocate memory for new thread stacks.
read sem acq nsecs: 289024806434545, elapsed: 136694836,  pid=78649, tid=101987, comm=QueryPipelineEx, kstack:
        cleanup_module+31190
        bpf_get_stackid_raw_tp+82
        cleanup_module+31190
        cleanup_module+622505
        down_read+5
        __do_page_fault+925
        do_page_fault+55
        page_fault+30
, ustack:
        _ZN2DB12_GLOBAL__N_113NumbersSource8generateEv.ce167cef01fb4e5fa936600afacf03c4+200
        0x7ffe8d709008
        0x7ffa371ed000
The stack trace pointed to threads waiting on mmap_sem as a major reason for the delays in thread creation and scheduling.
Why mmap Semaphore Contention Impacts the Thread Pool So Much
It’s somewhat surprising that thread creation in the thread pool was the primary slowdown. The mmap_lock (or mmap_sem) is not only used during thread creation but also during page faults and memory allocations or deallocations, so usually, contention there affects multiple aspects of the system simultaneously.
However, in the case of the thread pool, this contention leads to a cascading effect:
- Increased load due to concurrent queries: As more queries are executed simultaneously, the demand on the system increases.
- High concurrency on memory mapping read/write access: The increased load results in many threads performing memory mapping operations at the same time.
- High contention on the
mmaplock/semaphore in the kernel: The kernel’smmaplock becomes heavily contended due to these simultaneous memory operations. - Slow thread creation: This contention causes delays in creating new threads, as each thread creation requires acquiring the
mmaplock. - Prolonged locks in the ClickHouse thread pool: The thread pool holds locks while waiting for thread creation, extending the duration of these locks.
- Free threads cannot take new tasks: Free threads in the pool are unable to accept new tasks because they’re blocked by the held locks. This leads to underperformance of the thread pool and leaves many tasks unprocessed.
- Misinterpretation of the high number of unprocessed tasks: ClickHouse misinterprets the backlog of tasks as an increased demand for threads.
- Decision to start new threads: In response, ClickHouse decides to create more threads. However, due to the existing contention and slowdowns, this only exacerbates the problem.
This leads to a vicious cycle where the attempts to resolve the slowdown actually intensify it. Even when the lock contention eventually decreases and threads are able to take on tasks, they often execute the accumulated tasks quickly. This results in many threads becoming idle, and the thread pool recognizes that it is overprovisioned—with more free threads than the max_thread_pool_free_size parameter allows. Consequently, it shrinks the pool by terminating excess threads.
The next time the workload increases, the same problem arises again: the thread pool needs to create new threads under contention, restarting the cycle.
The Role of mincore Calls
While investigating the issue further, we discovered that a large number of mincore() system calls were being made. mincore() checks whether pages of memory are resident in memory or swapped out, but in our case, these calls were done for a rather trivial reason—to check if the pointers are valid in libunwind during the memory profiler work. This was addressed in PR #60468, which modified ClickHouse to stop using mincore() for pointer validity checks during stack unwinding.
Without those mincore() times of thread creation get stabilized a lot, and pthread_create() latencies dropped from hundreds of milliseconds to much lower values in high-load scenarios. So while the problem is visible even when they are not there, the scale of the problem is smaller.
ClickHouse: Moving Thread Creation Out of the Critical Path
The investigation led us to focus on one key culprit: the thread creation process itself. ClickHouse’s thread pool was designed to handle massive workloads by dynamically expanding and contracting the number of threads based on demand. However, under high-concurrency scenarios, it became clear that thread creation was happening within a critical section of the code. This meant that while one thread was being created, the rest of the thread pool had to wait, significantly slowing down task scheduling.
The solution was to move the thread creation process outside of the critical section to prevent the rest of the thread pool from being blocked while a new thread was being spawned. This fix meant that while new threads were still being created in the background, other threads could continue processing tasks, improving the overall efficiency of the thread pool.
A key PR was submitted that implemented this fix: PR #68694. In this PR, thread creation was moved out of the locked section, allowing other tasks to be scheduled and executed without being held up by thread creation delays.
Improving Fairness in Job Scheduling: Another important change was ensuring that job scheduling followed a more consistent order, processing jobs in a FIFO (first-in, first-out) manner. This ensured that jobs with the same priority were handled fairly and weren’t stuck in the queue longer than necessary.
Performance Gains
The performance improvements were immediately noticeable, especially in high-concurrency scenarios. Let’s start with an example comparing key metrics before and after the fix:
Before the Fix:
localhost:9000, queries: 2000, QPS: 91.536, RPS: 63416263.944, MiB/s: 483.827.
...
95.000% 7.553 sec.
99.000% 9.198 sec.

sum(ProfileEvent_GlobalThreadPoolLockWaitMicroseconds):   24,515,791,498
sum(ProfileEvent_LocalThreadPoolBusyMicroseconds):        20,795,340,229
sum(ProfileEvent_LocalThreadPoolJobWaitTimeMicroseconds): 19,762,541,701
After the Fix:
localhost:9000, queries: 2000, QPS: 100.308, RPS: 73195401.707, MiB/s: 558.436.
...
95.000% 3.523 sec.
99.000% 4.579 sec.

sum(ProfileEvent_GlobalThreadPoolLockWaitMicroseconds):       28,217,693
sum(ProfileEvent_LocalThreadPoolBusyMicroseconds):        21,127,410,099
sum(ProfileEvent_LocalThreadPoolJobWaitTimeMicroseconds):    143,136,141
Key Improvements:
- Lock Contention: Lock wait time dropped by 860x, drastically reducing task scheduling delays.
- Higher QPS: A 10% increase in Queries Per Second (QPS), improving throughput under high concurrency.
- Improved Latency: 95th and 99th percentile query times reduced from 7.55s/9.2s to 3.52s/4.57s.
- Efficient Thread Pool: The thread pool became 99.5% efficient, with minimal time spent on job management, compared to a 51%-49% split before.
These improvements were observed in synthetic tests, but real-world gains, while still notable, might be less dramatic depending on the workload.
Moving Forward
The journey to optimize ClickHouse doesn’t end here. There are still opportunities to further improve thread management, particularly around lock-free thread pools and smarter thread pre-allocation. With these changes, ClickHouse is better equipped to handle the high concurrency demands of modern workloads, but several future directions remain:
- Better Conditional Variable Notifications: During code review, small issues with conditional variable notifications were identified. Addressing these will result in future pull requests.
- Smarter Thread Pre-allocation: Pre-creating a pool of threads before workload spikes could minimize delays associated with thread creation.
- Improved Thread Recycling: Reusing existing threads more effectively would reduce the need for frequent thread creation and destruction, leading to more consistent performance.
- Lock-free Thread Pools: Completely eliminating locks from the thread pool could allow for even higher concurrency and reduce scheduling delays. Exploring lock-free structures or sharding of the global thread pool could bring additional performance gains while maintaining existing guarantees.
- Experiment with Preallocating Thread Stacks: This can potentially help avoid kernel-level
mmapdelays.
Practical Recommendations for End Users
The performance problem described affected all ClickHouse releases before version 24.10 but only impacts users with relatively high concurrency load patterns.
How to Check if Your System is Affected
- High Load Average with Low CPU Utilization: Load average sometimes rises to values much higher than the number of CPUs, often while the CPU is underutilized.
- High Number of Simultaneous Queries: You frequently have more than a few dozen simultaneous queries.
- Dynamic Changes in Global Thread Pool Size: The
GlobalThreadmetric shows significant fluctuations in the thread pool size. - Free Threads During Thread Pool Expansion: When the global thread pool size is expanding, there are still free threads available (i.e.,
GlobalThreadActiveis smaller thanGlobalThread). - ClickHouse Becomes Unresponsive at Times: ClickHouse tends to “freeze” occasionally, returning responses to even simple queries very slowly (e.g., timeouts in health checks, metrics scraping).
If you have the system.metric_log enabled, you can use the following query to detect incidents when the thread pool misbehaves:
SELECT
    host,
    event_time,
    CurrentMetric_GlobalThread,
    CurrentMetric_GlobalThreadActive,
    PreviousEventTime,
    Prev_CurrentMetric_GlobalThread,
    Prev_CurrentMetric_GlobalThreadActive,
    (CurrentMetric_GlobalThread - CurrentMetric_GlobalThreadActive) AS Unused_Threads,
    (Prev_CurrentMetric_GlobalThread - Prev_CurrentMetric_GlobalThreadActive) AS Prev_Unused_Threads,
    (CurrentMetric_GlobalThread - Prev_CurrentMetric_GlobalThread) AS Thread_Increase
FROM (
    SELECT
        hostName() AS host,
        event_time,
        CurrentMetric_GlobalThread,
        CurrentMetric_GlobalThreadActive,
        lagInFrame(event_time) OVER w AS PreviousEventTime,
        lagInFrame(CurrentMetric_GlobalThread) OVER w AS Prev_CurrentMetric_GlobalThread,
        lagInFrame(CurrentMetric_GlobalThreadActive) OVER w AS Prev_CurrentMetric_GlobalThreadActive
    FROM clusterAllReplicas('{cluster}', merge(system, '^metric_log'))
    WHERE event_time > now() - INTERVAL 30 DAY
    WINDOW w AS (PARTITION BY host ORDER BY event_time)
)
WHERE
    Prev_CurrentMetric_GlobalThread > 0
    AND (Prev_CurrentMetric_GlobalThread - Prev_CurrentMetric_GlobalThreadActive) > 10
    AND (CurrentMetric_GlobalThread - CurrentMetric_GlobalThreadActive) > 10
    AND (CurrentMetric_GlobalThread - Prev_CurrentMetric_GlobalThread) > 10
FORMAT Vertical;
If this query returns a significant number of rows, especially if you observed problems with the cluster at the same times reported by the query, your cluster is likely impacted by this issue.
What You Can Do
- Upgrade to a Newer Version:
Upgrading to ClickHouse version 24.10 or later, which includes the thread pool optimizations, will provide immediate performance improvements and new metrics to help diagnose and resolve these issues. - Use a Newer Kernel:
Recent kernel versions have introduced improvements around locking memory maps, reducing kernel-side contention, and enhancing overall performance. - Control Concurrency More Effectively:
Make every effort to reduce the number of concurrent queries, as excessive threads can overload the thread pool, leading to lock contention and delays. Efficient resource usage doesn’t require thousands of threads. For high-concurrency workloads, set limits on individual queries (e.g.,max_execution_time=10,max_threads=1,max_bytes_to_read=10000000,max_concurrent_queries_for_user=50in the profile) to prevent them from stacking up. You can also reduce the number of simultaneous queries (max_concurrent_queries) or adjust the worker threads per query (max_threads). Recent versions also offerconcurrent_threads_soft_limit_ratio_to_coresorconcurrent_threads_soft_limit_numMany issues arise from unexpected queries, poorly optimized SQL, or aggressive retries – make sure you are nor allow those to abuse your server. Consider settings likecancel_http_readonly_queries_on_client_closeto avoid leaving queries running unnecessarily. - Disable the Memory & Query Profilers on Versions Before 24.6:
On older versions, disabling memory and query profiling can mitigate the problem by reducing the number of unwinds and relatedmincoresystem calls.
<clickhouse>
    <profiles>
        <default>
            <memory_profiler_step>0</memory_profiler_step>
            <query_profiler_real_time_period_ns>0</query_profiler_real_time_period_ns>
            <query_profiler_cpu_time_period_ns>0</query_profiler_cpu_time_period_ns>
        </default>
    </profiles>
</clickhouse>- Increase the Minimum Number of Free Threads in the Pool:
Increase themax_thread_pool_free_sizeparameter to ensure more threads are kept ready for incoming tasks. This reduces delays from frequent thread creation during high load.
<clickhouse>
    <max_thread_pool_free_size>2500</max_thread_pool_free_size>
</clickhouse>
By following these steps, you can alleviate performance issues in older versions of ClickHouse, even if you cannot fully eliminate the root cause of thread pool contention without upgrading.
Key Takeaways
The journey to diagnose and resolve ClickHouse’s thread pool performance issues highlighted the complexity of working with highly concurrent systems. By deep-diving into thread scheduling, lock contention, and memory profiling behavior, we were able to significantly optimize performance under load. Here are the key lessons learned:
- Thread Pool Bottlenecks Can Be Subtle:
Even with available CPU resources, thread pool bottlenecks—particularly in critical sections—can severely impact performance. Monitoring thread pool metrics early can prevent significant slowdowns. - Metrics Are Essential:
Without detailed metrics and system introspection, identifying thread pool inefficiencies would have been nearly impossible. The new thread pool metrics (PR #68674), such asGlobalThreadPoolLockWaitMicrosecondsandGlobalThreadPoolThreadCreationMicroseconds, provided deep insights into thread pool efficiency and helped pinpoint bottlenecks. - Kernel-Level Contention Is a Hidden Enemy:
Issues likemmapsemaphore contention during thread creation caused significant slowdowns. Tools likeeBPFandperfwere invaluable in diagnosing these kernel-level issues. Addressing these bottlenecks further improved performance. - Optimizing Thread Creation Matters:
Moving thread creation outside of critical sections improved both thread pool efficiency and query performance under load. Implementing the fix from PR #68694 is critical for minimizing lock contention and improving throughput in high-concurrency environments. - Stay Updated with ClickHouse and Kernel Releases:
Newer versions of ClickHouse and Linux kernels often include performance improvements. Regularly check changelogs and keep your systems updated to benefit from these optimizations. - Memory Profiling and Overheads Matter Under High Load:
Disabling unnecessary memory profiling mechanisms, such asmincore, removed a major source of slowdown, enabling the thread pool to operate more smoothly. Addressing these overheads can prevent performance degradation in high-concurrency scenarios.
Conclusion
Diagnosing performance issues in highly concurrent systems like ClickHouse requires careful investigation and optimization at both the application and kernel levels. This deep dive into thread pool performance allowed us to uncover bottlenecks, make targeted improvements, and significantly enhance ClickHouse’s ability to handle high-concurrency workloads.
By implementing these optimizations and keeping up with the latest versions of ClickHouse and Linux kernels, developers and administrators can prevent potential performance slowdowns. Continuous monitoring, smarter thread management, and system-level insights will ensure that ClickHouse remains responsive and scalable in modern environments.
Happy debugging!
ClickHouse® is a registered trademark of ClickHouse, Inc.; Altinity is not affiliated with or associated with ClickHouse, Inc.