Open Source
Petabyte-Scale Data in Real-Time: ClickHouse®, S3 Object Storage, and Data Lakes
These days new ClickHouse® applications start with petabyte-sized datasets and scale up from there. Fortunately, ClickHouse® gives you open-source tools for real-time analytics on big data: MergeTree backed by object storage as well as reading on data lakes. We'll start by showing you popular design patterns for ingest, aggregation, and queries on source data. We'll then dig into specific best practices for defining S3 storage policies, reading from Parquet data, backing up, monitoring, and setting up high-performance clusters in the cloud. It's all open source and works in any cloud. Join us!

Petabyte-Scale Data in Real-Time: ClickHouse, S3 Object Storage, and Data Lakes
These days new ClickHouse applications start with petabyte-sized datasets and scale up from there. Fortunately, ClickHouse gives you open-source tools for real-time analytics on big data: MergeTree backed by object storage as well as reading on data lakes. We'll start by showing you popular design patterns for ingest, aggregation, and queries on source data. We'll then dig into specific best practices for defining S3 storage policies, reading from Parquet data, backing up, monitoring, and setting up high-performance clusters in the cloud. It's all open source and works in any cloud. Join us!
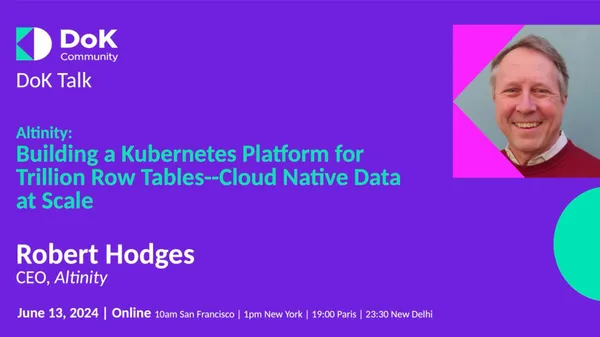
Building a Kubernetes Platform for Trillion Row Tables– CN Data at Scale
Kubernetes is an amazing platform for data, but it requires focus to deliver production apps, especially if they are large. In this talk I'll share learnings from operating a database SaaS for ClickHouse as well as helping customers do it themselves. We'll describe some of the attributes of large analytic applications, then discuss common approaches to building platforms to operate them. Our talk will cover use of standard tools like Terraform, Helm, and Argo CD, which work together to bring up Kubernetes and the apps that run inside it. Along the way we'll describe various "aha!" experiences, tools, and even team organization to support large database applications on Kubernetes.
Showing Beautiful ClickHouse® Data with the Altinity Grafana Plugin
The Altinity Grafana Plugin for ClickHouse is the most popular plugin for creating dashboards on ClickHouse data with over 15M downloads. In this webinar, we'll reveal how it works and how you can use it to create flexible, attractive dashboards for ClickHouse. We'll also show how you can use the plugin to create custom dashboards for Altinity.Cloud clusters and introduce some cool samples that work on any ClickHouse server. Finally, we'll discuss the roadmap for the plugin. Join us to learn how to create beautiful data!

DevOpsDays Nashville 2024 Talk: Modern Application Debugging: An Introduction to OpenTelemetry
In this talk, Josh will be sharing his insights and experiences with OpenTelemetry, an open-source project that offers protocols, APIs, and SDKs for collecting metrics, traces, and logs from applications and services. He will cover the tools provided by the OpenTelemetry Community, including the Language SDKs, the Collector, and the OTLP formats for Metrics, Traces, and Logs. He will demonstrate how to instrument and observe a microservices application running on a Kubernetes cluster, utilizing the resources that OpenTelemetry has to offer. You will gain a deeper understanding of using open-source tools like Jaeger and Prometheus to analyze the telemetry signals from your application.

The Analytics Easy Button, or: How to Deploy ClickHouse® Services with Terraform, Helm, or Argo CD
Push-button deployment is the holy grail of analytic platforms, but what's the right path to fulfill your quest? In this webinar, we'll show the standard ways to deploy scalable, open-source ClickHouse services on Kubernetes using Terraform, Helm, or Argo CD. Altinity.Cloud shortcuts to bring up fully managed, supported ClickHouse databases are of course included. Expect demos and working code examples you can nab to create your own easy buttons. From there the analytic possibilities are endless: from Kafka sinks for your entire org to observability pipelines that handle gigabytes of data per second. Join us to see how!

User Management in ClickHouse® Databases: The Unabridged Edition
User management is a key problem in any analytic application. Fortunately, ClickHouse has a rich set of features for authentication and authorization. We're going to tell you about all of them. We'll start with the model: users, profiles, roles, quotas, and row policies. Then we'll show you implementation choices from XML files to SQL commands to external identity providers like LDAP. Finally, we'll talk about features on the horizon to improve ClickHouse security. There will be a sample code plus plenty of time for questions. Join us to learn how to manage your users simply and effectively.
DevOpsDays Vilnius 2024: Open Source Ecosystem for ClickHouse® on Kubernetes
Discover the open-source tools necessary to deploy, monitor, manage, and utilize your analytical ClickHouse database on Kubernetes. Whether you're using a cloud-managed Kubernetes solution or have your deployment, this talk will provide invaluable insights into navigating the open-source ecosystem for ClickHouse. We will explore the key components needed to seamlessly integrate ClickHouse into your Kubernetes environment and maximize its analytics and data processing potential.
The benefit of the ecosystem: Attendees will gain essential insights into deploying ClickHouse databases on Kubernetes using open-source tools. Whether using cloud-managed Kubernetes or self-deployed environments, join us to streamline your ClickHouse deployment and contribute to enhanced efficiency and innovation in data management within the ecosystem.

DevOpsDays Tampa Bay 2024 Talk: Modern Application Debugging: An Introduction to OpenTelemetry
In this talk, Josh will be sharing his insights and experiences with OpenTelemetry, an open-source project that offers protocols, APIs, and SDKs for collecting metrics, traces, and logs from applications and services. He will cover the tools provided by the OpenTelemetry Community, including the Language SDKs, the Collector, and the OTLP formats for Metrics, Traces, and Logs. He will demonstrate how to instrument and observe a microservices application running on a Kubernetes cluster, utilizing the resources that OpenTelemetry has to offer. You will gain a deeper understanding of using open-source tools like Jaeger and Prometheus to analyze the telemetry signals from your application.

Kubernetes Cluster Logging with the OpenTelemetry Collector and ClickHouse®
Logs may be looked down upon by today’s observability thought leaders, but there is a reason they are the first pillar of observability: there’s a relevant log message at the end of almost every debugging journey! Collecting those logs from applications and infrastructure in a standard format is now trivial thanks to the OpenTelemetry Collector, and we get to keep it in the same format — and potentially the same database — as our other telemetry signals like traces, metrics, and profiles.
In this webinar, we’ll show how to use the OpenTelemetry Collector to gather all application and cluster logs from a Kubernetes cluster. We’ll use ClickHouse to store and query our logs and Grafana to visualize trends. By the end of the session, you’ll have everything you need to standardize your cluster logs on the most forward-looking format available today: OpenTelemetry.

OpenInfra Days North America Talk at Indiana University: Modern Application Debugging: An Introduction to OpenTelemetry
In this talk, Joshua will share his insights and experiences with OpenTelemetry, an open-source project that offers protocols, APIs, and SDKs for collecting metrics, traces, and logs from applications and services. He will cover the comprehensive toolkit provided by the OpenTelemetry community, including language SDKs, the Collector, and the OTLP formats for metrics, traces, and logs.
He will demonstrate how to instrument and monitor a microservices application running on a Kubernetes cluster, utilizing the full potential of OpenTelemetry. Attendees will learn how to use powerful open-source tools like Jaeger and Prometheus to effectively analyze telemetry signals from their applications.
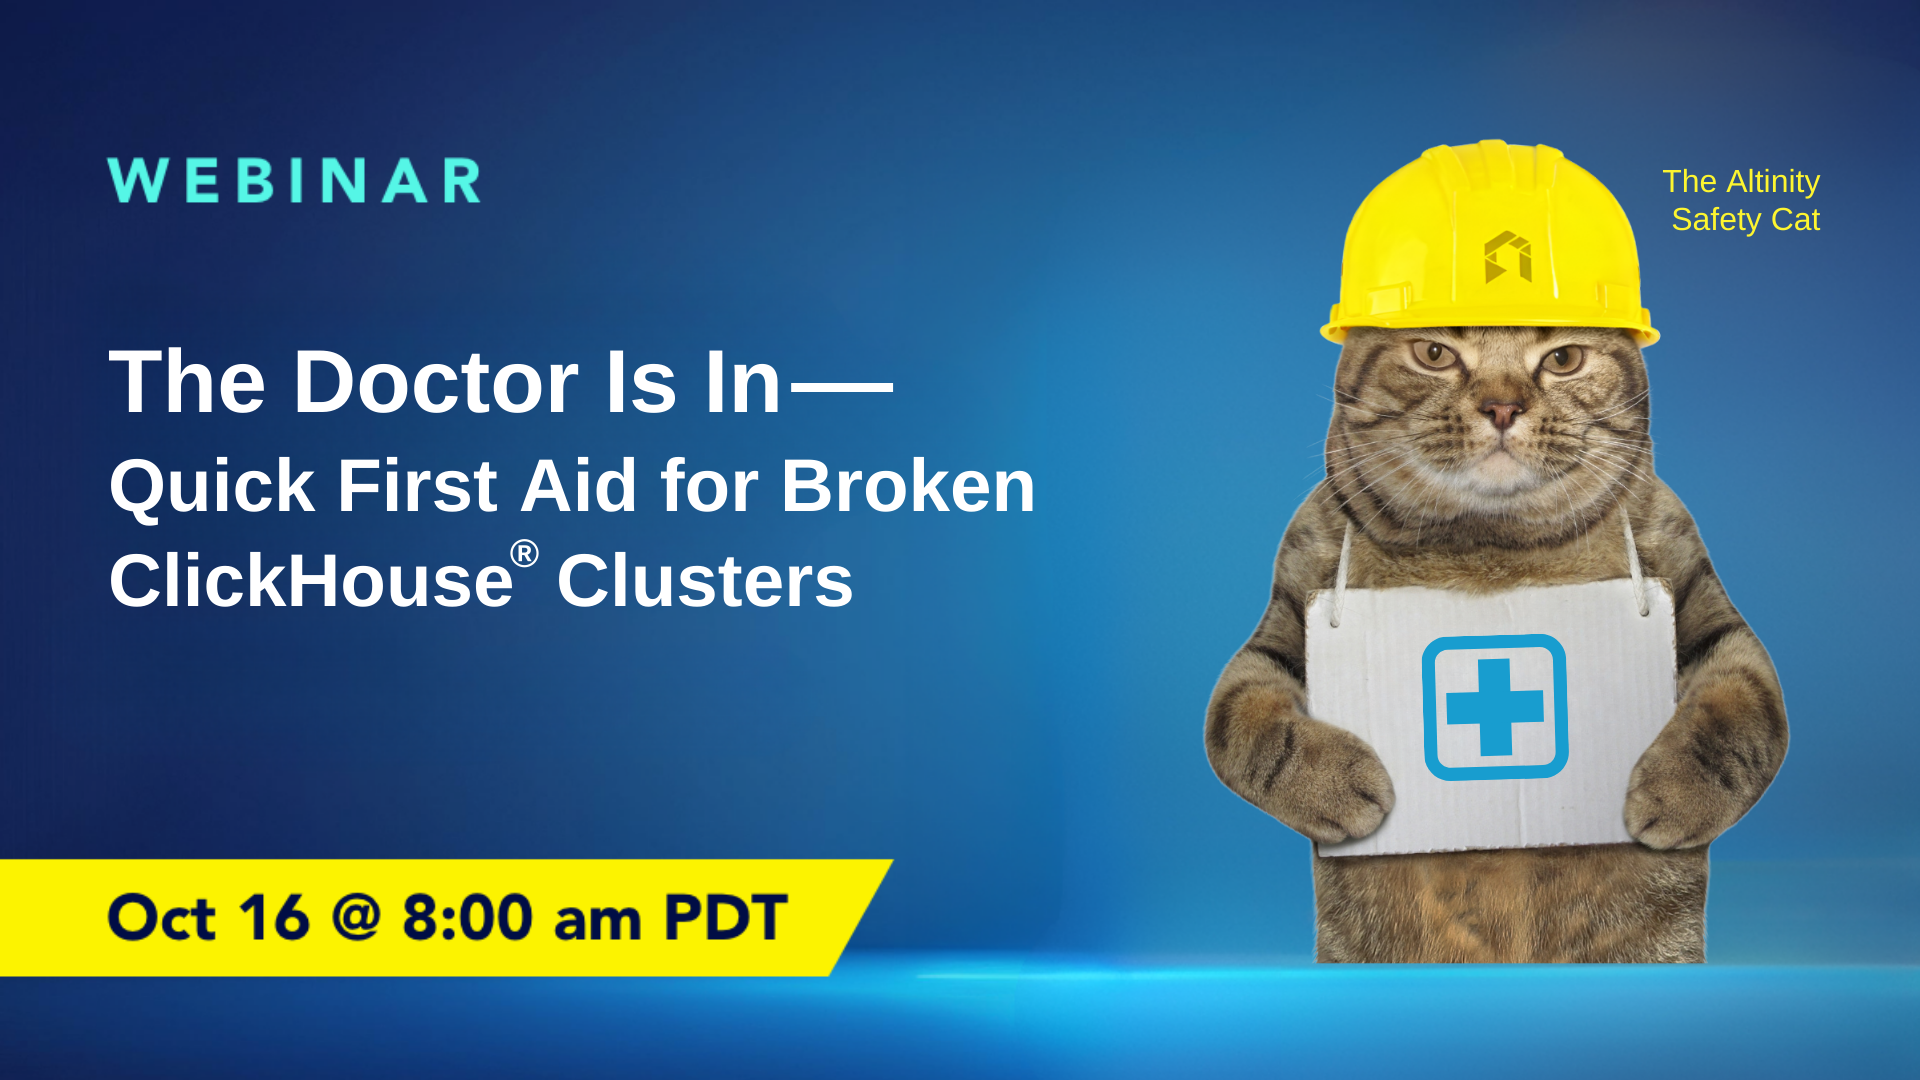
The Doctor Is In–Quick First Aid for Broken ClickHouse® Clusters
Properly managed ClickHouse servers are well-behaved, but every cluster runs into problems at some point.
In this webinar, we'll introduce common issues that require admin intervention or even application changes. Topics include too many connections, too many parts, lost replicas, stuck mutations, and too many detached parts on startup. In each case, we'll explain the problem, show you the symptoms, and give you the standard cures.
There will be extra time for questions, so bring your favorites. We'll be happy to offer opinions.