Altinity Grafana Plugin for ClickHouse®: Ready for Grafana 10 and Beyond
The Altinity Grafana Plugin for ClickHouse 3.0.0 is fully compatible with Grafana 10. Find out how to get it and see the roadmap. 15M downloads can’t be wrong!
The Altinity Grafana Plugin for ClickHouse 3.0.0 is fully compatible with Grafana 10. Find out how to get it and see the roadmap. 15M downloads can’t be wrong!

OpsVerse replaced Cassandra with ClickHouse for Jaeger traces, built a full APM module with materialized views and Grafana — no changes to Jaeger’s code.
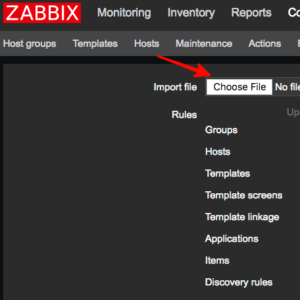
Altinity is happy to introduce a new tool in ClickHouse environment – Zabbix template for monitoring ClickHouse. It is open source and available on githubLet’s walk in details on how to install and setup this template.
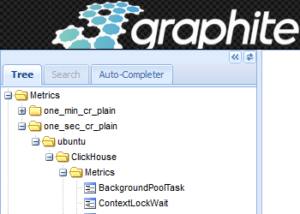
A few weeks ago we described how to setup ‘ClickHouse monitoring with Graphite’. Today we are going to look at this from a different angle: how ClickHouse can be used as a Graphite backend.
Monitoring is an important part of operating any software in production. The proper monitoring solution needs to store metrics somewhere as well as provide visualization capabilities. ClickHouse does not have such a tool packaged, but there are several 3rd-party monitoring…

In this blog post, I’ll look at how you can analyze MySQL audit logs (Percona Server for MySQL) with ClickHouse and ClickTail. Audit logs are available with a free plugin for Percona Server for MySQL. Besides providing insights about activity on…
We use cookies to enhance your experience. By consenting, we can process data like browsing behavior or unique IDs. Without consent, some features may not work as expected.