BlueHoover: Analyzing BlueSky posts with ClickHouse®
Have you ever wanted to know whether cats or dogs are more popular on a social network? Now, with the power of ClickHouse, you can answer that and many other questions about what people are talking about on Bluesky.
This is all thanks to BlueHoover, an awesome new hobby project by Joe Redfern of SenseOn. The project uses python scripts to hoover up a firehose of every Bluesky post and store them in a ClickHouse database. You can easily run it yourself (it’s dockerized) on pretty much any hardware. I’ve left it running on an 8-core MiniPC, and I forgot I had it running.
This is just awesome – and I don’t use that word lightly. It reminds me of the earlier days of the internet when places like Twitter and Reddit were considered public forums, with open APIs available to all. What’s new is with the relative power of modern mini-PCs and the small but growing volume on BlueSky, this kind of knowledge-graph recording is more accessible than ever before.
Let’s take a look at how the project works and leverages ClickHouse to achieve this awesome performance.
If you love ClickHouse®, Altinity can simplify your experience with our fully managed service in your cloud (BYOC) or our cloud and 24/7 expert support. Learn more.
Architecture
I’ll let Joe describe the overall architecture:
BlueHoover consumes the Bluesky Jetstream websocket feed, extracting post events, and writing them to a posts table in ClickHouse in batches.
On the ClickHouse side, the tokenizer Materialized View is attached to the posts table and updates a
tokens_by_intervaltable with the tokens found in the posts.tokens_by_intervalis aSummingMergeTree, with an ordering key on(token, period), whereperiodis the 10-minute interval in which the post was created. Tokenization is currently very basic, simply splitting on non-alphanumeric characters with ClickHouse’ssplitByNonAlpha()function, and then lowercasing.Trends are identified by comparing the count of a token in the last hour with the average count of that token in the previous 24 hours. This is performed by the
trends_1hr_mvRefreshable Materialized View, refreshing hourly, and updating thetrends_1hrtable with the results.
A basic FastAPI webapp is provided for viewing the trends, and visualizing token rates.
The Jetstream Websocket feed is a lightweight alternative to running a full Bluesky relay, and there are several instances hosted by the Bluesky team.
Visualizing the Data Yourself
Getting started yourself is extremely straightforward: clone the repo and run docker compose up – since the project includes a reverse proxy, you can access the web UI at locahost:80.
We can see the results:
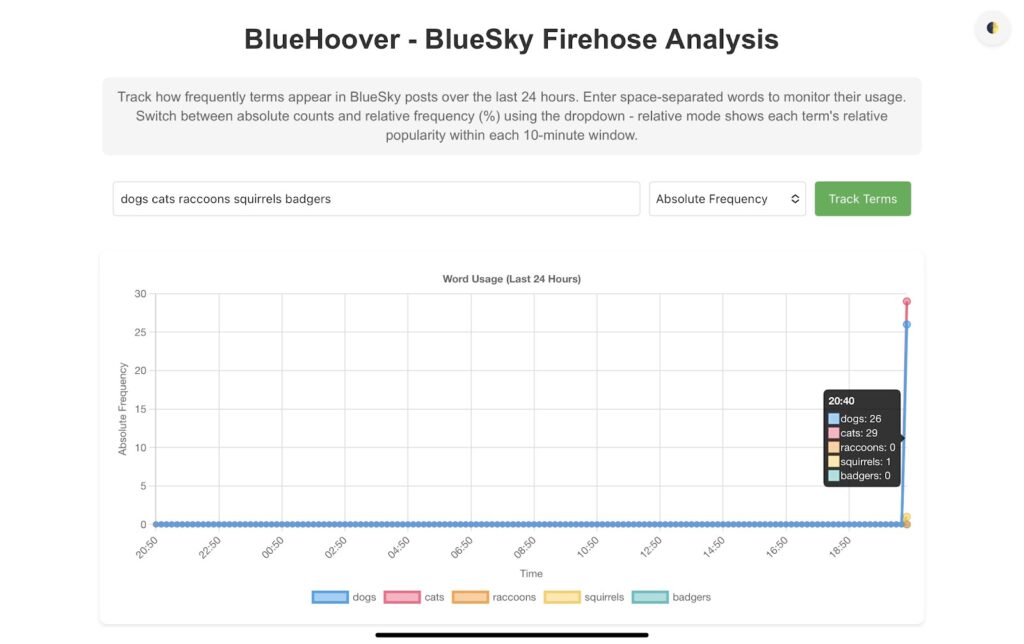
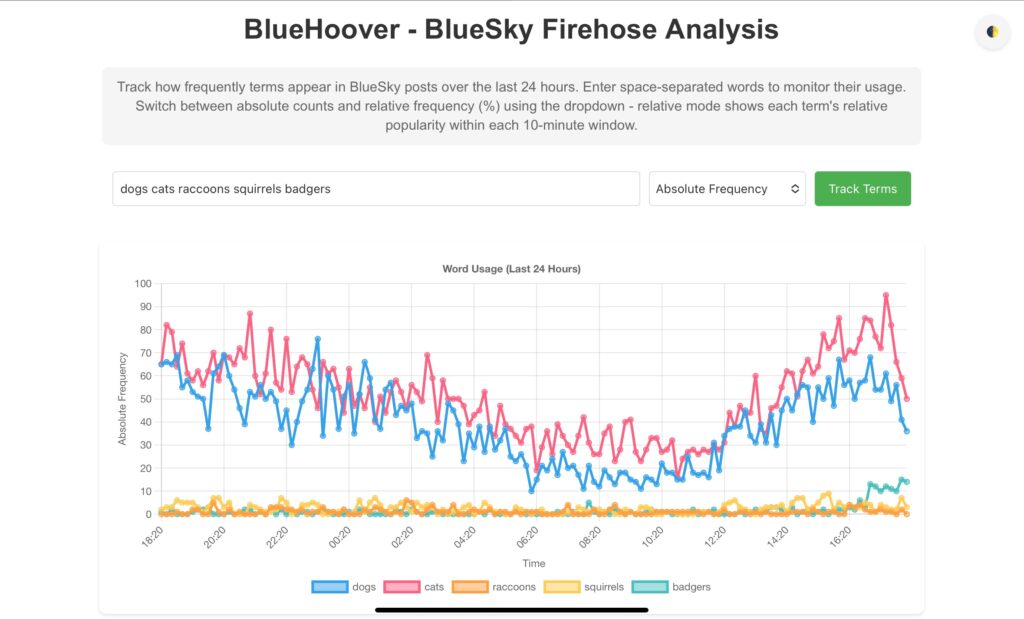
Since you’re ingesting your own copy of the BlueSky firehose, it will take some time for the visualizations to fill in – although here we can see that I have some results after just a few minutes. I recommend letting it run for at least an hour before coming back to play with it more. You can also backfill by editing cursor.txt to a timestamp 20-24 hours in the past. Here’s what things look like once they are filled in:
The Schema
This is pretty cool! While we’re waiting for data, let’s take a look at the schema:
Example Queries
With the architecture and schema in place, we can start exploring the wealth of data BlueHoover has collected. Here are a few example queries to get you started:
CREATE TABLE IF NOT EXISTS posts (
    cid String,
    uri String,
    created_at DateTime64(3),
    author String,
    text String,
    reply_parent_uri String,
    insertion_time DateTime64(3) DEFAULT now64()
) ENGINE = MergeTree()
ORDER BY (created_at, cid)

CREATE TABLE IF NOT EXISTS tokens_by_interval (
    `period` DateTime64(3),
    `token` String,
    `count` UInt64
) ENGINE = SummingMergeTree
ORDER BY (period, token)

CREATE MATERIALIZED VIEW IF NOT EXISTS tokenizer TO tokens_by_interval (
    `period` DateTime,
    `token` String,
    `count` UInt8
) AS SELECT
    toStartOfInterval(created_at, toIntervalMinute(10)) AS period,
    arrayJoin(splitByNonAlpha(lower(text))) AS token,
    1 AS count
FROM posts
Most Active Authors
If you’re interested in knowing which authors are the most active on BlueSky, you can query the posts table:
SELECT
    author,
    COUNT(*) AS post_count
FROM
    posts
WHERE
    created_at >= now() - INTERVAL 1 DAY
GROUP BY
    author
ORDER BY
    post_count DESC
LIMIT 10
This will give you the top 10 authors who have posted the most in the last week.
Word Frequency Over Time
To analyze how the usage of specific words changes over time, you can use the tokens_by_interval table:
SELECT
    period,
    sum(count) AS total_count
FROM
    tokens_by_interval
WHERE
    token = 'clickhouse'
    AND period >= now() - INTERVAL 30 DAY
GROUP BY
    period
ORDER BY
    period ASC
This query tracks the usage frequency of the word “clickhouse” over the past month, broken down into 10-minute intervals.
Performance and Scalability
One of the standout features of ClickHouse is its exceptional performance, especially when dealing with large volumes of data. BlueHoover leverages ClickHouse’s columnar storage and parallel processing capabilities to ensure that queries are executed swiftly, even as the dataset grows.
Conclusion
BlueHoover exemplifies the synergy between open-source projects and powerful data platforms like ClickHouse. By enabling real-time ingestion and analysis of social media data from BlueSky, it opens up endless possibilities for understanding trends, user behavior, and the dynamics of online conversations.
Whether you’re a data enthusiast eager to explore social media analytics or a business looking to gain insights into your audience, BlueHoover provides the tools and flexibility to achieve your goals.
Kudos to Joe Redfern for developing such an interesting project.
Ready to dive in? Head over to BlueHoover’s GitHub repository to get started.
ClickHouse® is a registered trademark of ClickHouse, Inc.; Altinity is not affiliated with or associated with ClickHouse, Inc.