Creating Beautiful Grafana Dashboards on ClickHouse®: a Tutorial
Grafana is a popular tool to create interactive dashboards based on time series data. It features outstanding graphics, displays that filter or zoom in/out on data, and support for a wide range of data sources. One of those data sources is ClickHouse. As you will see shortly, Grafana is an excellent match to visualize information stored in ClickHouse.
This tutorial provides a soup-to-nuts introduction to Grafana on ClickHouse. We will start with installation, walk through development of a sample dashboard, and show basic techniques you can use to construct your own dashboards. Altinity maintains the ClickHouse Grafana plugin, so we’ll finish with a couple of notes on reporting issues and posting pull requests.
Grafana has such a rich feature set that it is not possible to show very many techniques in a short article like this. The article therefore includes a link to a fully constructed sample dashboard that you can load to see a non-trivial display. Combined with the article there should be enough to get you off and running.
With that, let’s jump in. The examples that follow use Ubuntu 18.04, Grafana 6.5.2, ClickHouse Grafana plugin 1.9.3, and ClickHouse 19.16.3.
Setting Up
We’ll need to have Grafana, ClickHouse, and a browser for this tutorial. Here’s a picture of the plumbing when things are up and running.
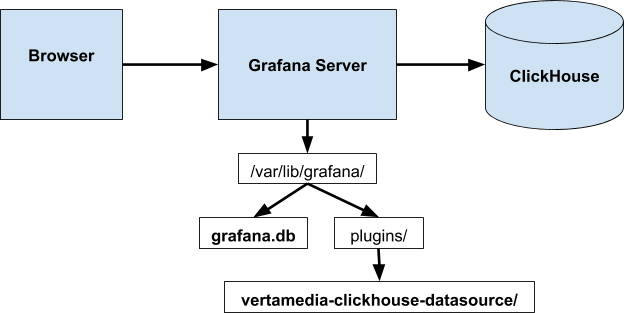
Grafana configuration data including data sources and dashboard layout are stored in grafana.db. The ClickHouse Grafana plugin is located in directory vertamedia-clickhouse-datasource. You can reset Grafana by wiping out the .db file and you can remove the ClickHouse plugin by deleting the directory. Always restart Grafana after any such changes.
Installing Grafana
Grafana runs as a service on Linux. You can get installation instructions on the Grafana website. Ubuntu installation is described here. I used the following commands to install Grafana 6.5.2 on my laptop.
sudo echo 'deb https://packages.grafana.com/oss/deb stable main'   > /etc/apt/sources.list.d/grafana.list
curl https://packages.grafana.com/gpg.key | sudo apt-key add -
sudo apt-get update
sudo apt-get install grafana
Installing the ClickHouse Grafana Plugin
Next, install the ClickHouse Grafana plugin using the grafana-cli tool, which is part of the Grafana server distribution. You must restart the server after the plugin is installed or Grafana will not recognize it.
sudo grafana-cli plugins install vertamedia-clickhouse-datasource
sudo systemctl restart grafana-server.service
At this point Grafana is ready go to. Let’s now turn to ClickHouse preparation.
Preparing ClickHouse
Actually there’s very little to do on ClickHouse. All you need is an accessible server with data. The Grafana ClickHouse plugin uses the HTTP interface, which by default uses port 8123 for HTTP traffic and 8443 for HTTPS. We’ll just confirm one of the ports is available using curl.
$ curl http://localhost:8123
Ok.
Next, we need data. While any interesting dataset will do, for this tutorial we’ll be using airline ontime statistics published by the US Bureau of Transportation Statistics. Downloading from scratch is painful but fortunately there’s a prepared version of the ontime data in the ClickHouse documentation. My dataset has data running out to 2017 but is otherwise similar to the example dataset.
Security
The examples in this tutorial run on localhost, so security is not a major consideration provided servers listen on the loopback interface rather than 0.0.0.0. If you are accessing Grafana on another host you should secure the Grafana server properly including enabling HTTPS and setting a secure password. Instructions for configuration are here.
Similarly, if ClickHouse is running locally on the Grafana server host, security is again less of a concern. Note, however, that anyone who has access to the Grafana server potentially can read all data in ClickHouse.
Creating a ClickHouse data source in Grafana
Let’s get started. The first step is to login to Grafana and create a data source, which is a connection to ClickHouse. Grafana is running locally, so we can just pop up a browser and login to http://locahost:3000. If you are connecting for the first time use admin/admin as user and password respectively. Grafana will invite you to reset the password, which you should do before proceeding further.
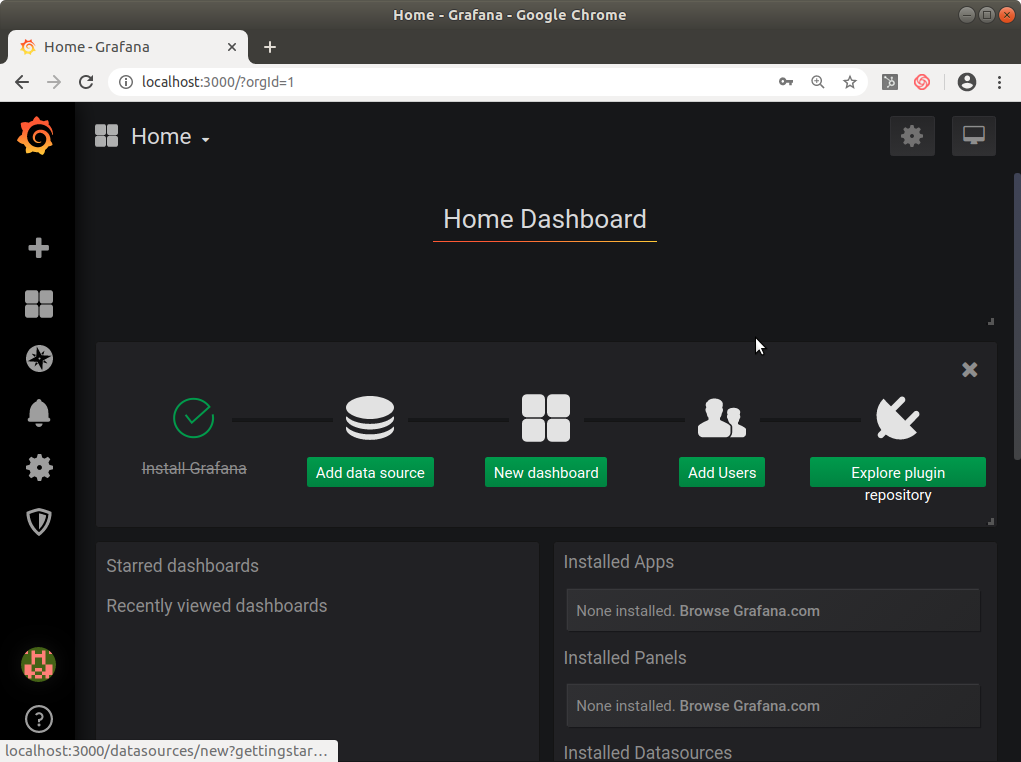
After successful login to a new Grafana server you will see the following screen. Press the ‘Add data source’ button to create a data source for your ClickHouse server.
Grafana will show a list of data sources that should include ClickHouse. It’s typically at the bottom of the list and looks like this:

Important note: If ClickHouse does not appear in the data source list, it means that there is an installation problem. Try the following to resolve.
Make sure the ClickHouse plugin is actually installed in /var/lib/grafana/plugins. If not, install it using grafana-cli as described in Setup.
Restart the Grafana server, for example using ‘systemctl restart grafana.server’. You need to do this after installation or Grafana will not see new plugins.
If that does not work, look at the message files in /var/log/grafana to see what went wrong. Installation generally works without much effort, so you should not have to do this often.
Assuming you do see ClickHouse as expected, press ‘Select’ on the ClickHouse dashboard, which will pop up a screen showing data source details. For this exercise we enter the server URL, select ‘Server’ access to make Grafana run ClickHouse connections through the server rather than directly from the browser, select ‘Basic Auth’ for authentication, and enter the ClickHouse server credentials. You can accept all other settings, including the ‘Default’ setting at the top, which means dashboards will use the data source automatically without extra configuration.
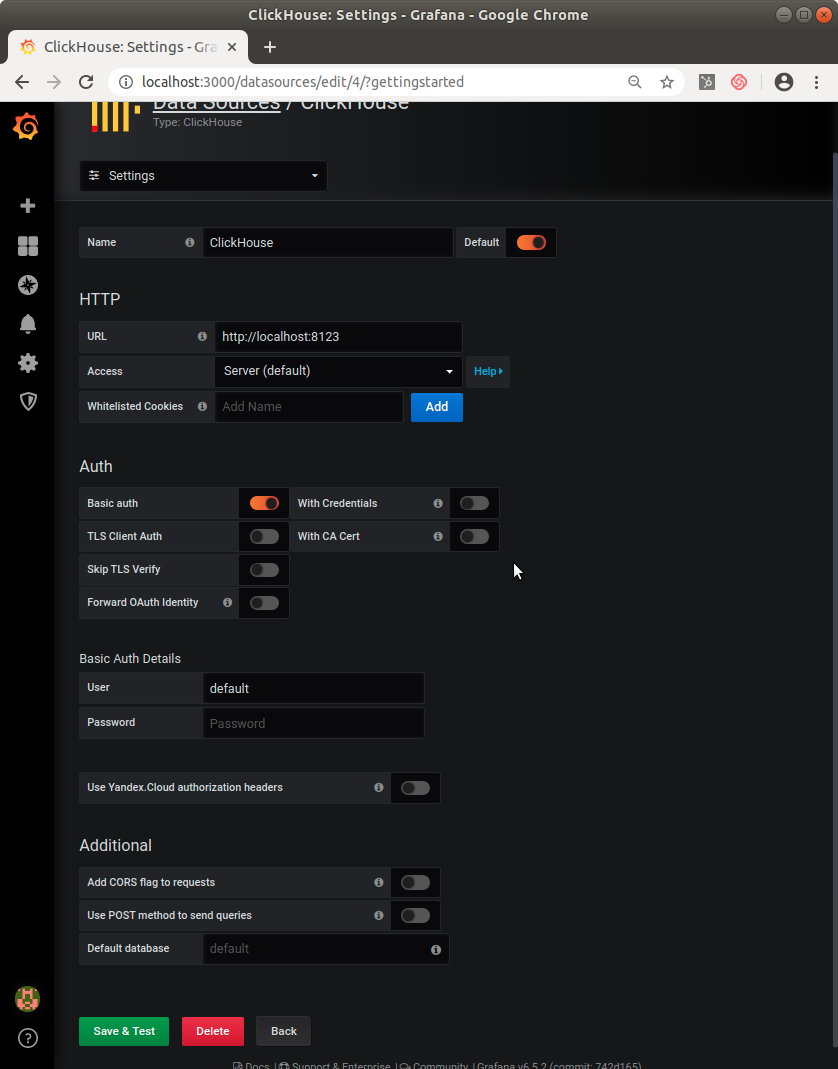
Press ‘Save & Test’ to complete setup. If you get an error at this point, the most likely reason is that ClickHouse is not available or you have entered the wrong authentication settings. Correct and try again until it works.
Creating a dashboard with a simple text panel
With the default data source set up, we can now create a dashboard. From the main Grafana screen press ‘Create your first dashboard’ to generate the dashboard. You’ll see a screen like the following.
![]()
![]()
Dashboards consist of panels. Each panel can show a graphic or text, typically using data fetched from the database. Each ClickHouse-based panel will have two parts: a SQL query and and a visualization that shows the results.
Let’s start with a very simple panel to show the total number of airlines available in our ontime data set. Press ‘Add Query’ on the panel, which shows the following screen.
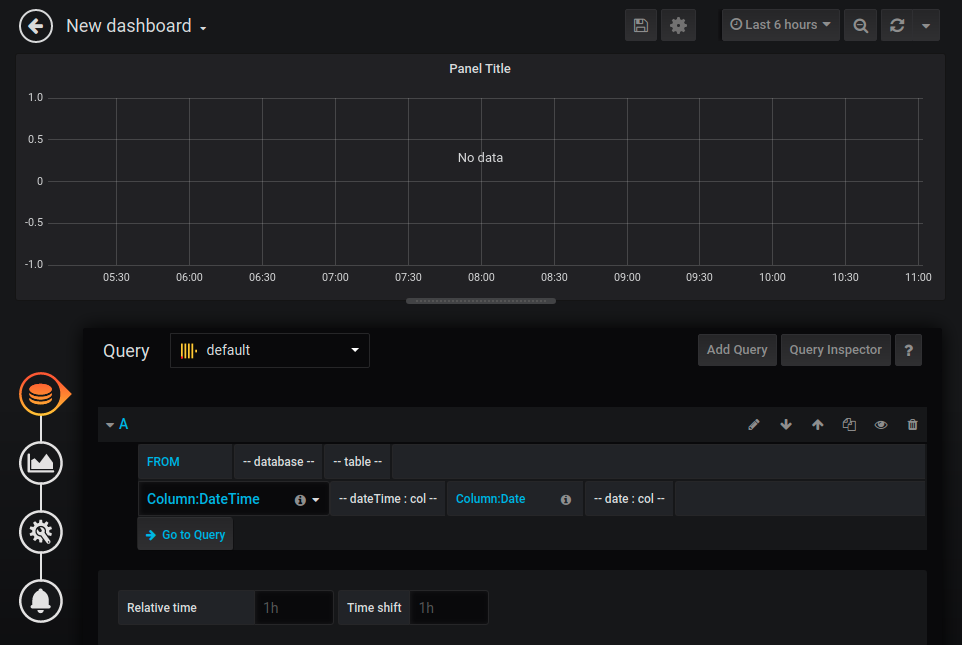
Grafana is optimized to show time series data, so the default query screen includes a lot of data that is not relevant for simple text displays. We’ll skip all of that and just press the ‘Go to Query’ button. Fill in the query as shown in the example below. Also, select ‘Table’ in the ‘Format as’ pull-down. This is important because our first panel is not time series data. It just shows a simple count that does not have time associated with it.
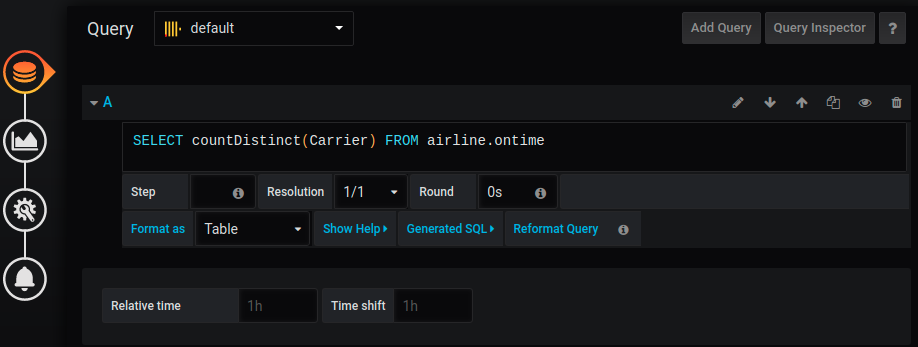
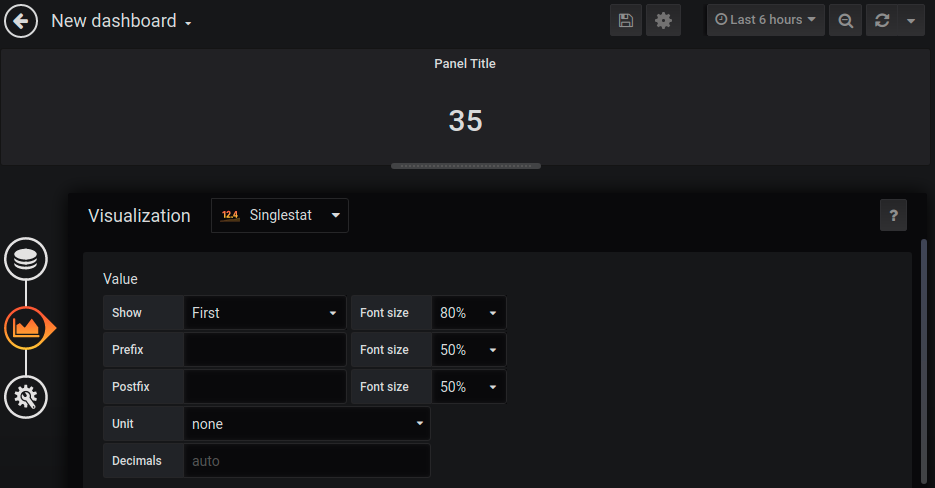
Next, press the graph icon on the left to pick a visualization format. Select ‘Singlestat’ as the Visualization from the drop down menu and First as the value to show. (Actually this last part does not matter much since there is only one value anyway.) You can use the defaults for all other settings.
Once you fill in the visualization settings, the editor should look like the following with an actual value in the panel.
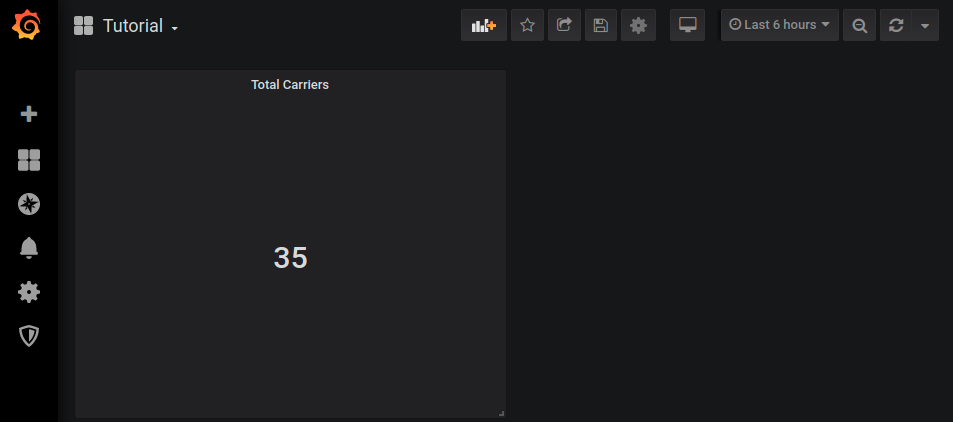
Finally, let’s do some renaming so that we know what we are looking at. Press the tools icon on the left, which allows you to give the panel a name like ‘Total Carriers’.
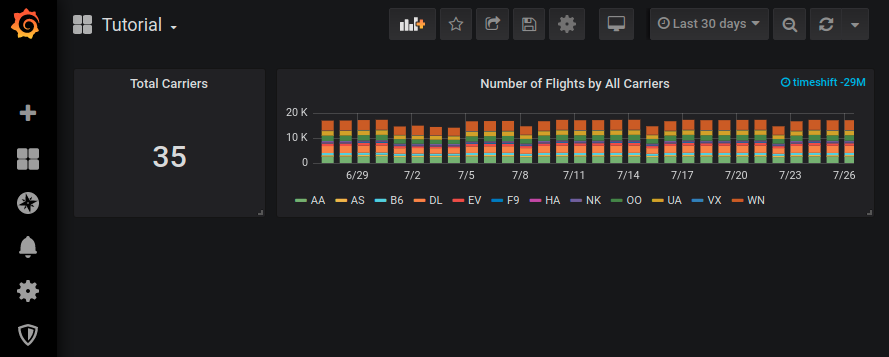
Next, press the tools icon on the top of the screen, which allows you to set the name of the dashboard. Enter a name like ‘Tutorial’ and press Save. Grafana will crunch for a few seconds to run the query and show a dashboard like the following. Let’s admire it briefly and move to the next section.
Adding time series data
Grafana really shines on time series data, so it’s time for us to add something a little more interesting. For this next step, let’s add a panel that computes the count of daily flights for each airline. This will demonstrate Grafana time series capabilities very nicely.
To get started press the graph icon at the top of the screen to add a new panel. Play around with the geometry so that it shows up to the right of the ‘Total Carriers’ panel. Grafana makes it easy to move and resize windows. Once you finish, press the ‘Add Query’ button as before.
Instead of jumping directly to the editor, we will instead add some metadata to tell Grafana a little bit about where the data comes from. Here’s the filled out screen.
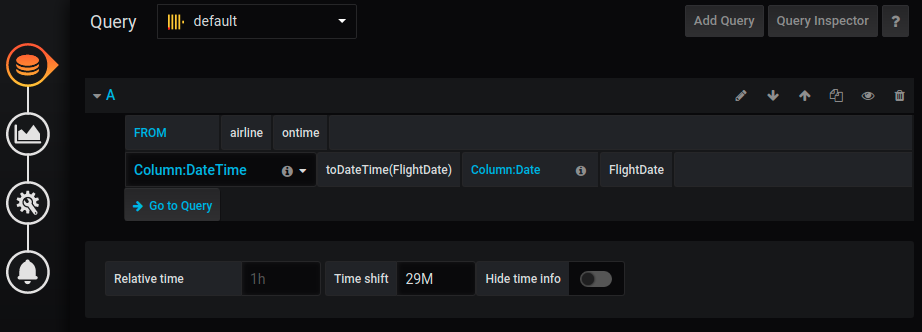
There are some additional fields here that need to be filled in. Let’s take them one by one.
FROM. This has drop downs for the database and table. It tells Grafana where the data are coming from.
Column:DateTime. Grafana needs a DateTime column to select time series. You must enter a column and it must be either a DateTime or Timestamp data type. Our sample dataset does not have either so we will convert FlightDate with a function. (Another option is to compute the exact departure time.)
Column:Date. We also add a Date column. We’ll just use FlightDate here. This is a special feature of the ClickHouse plugin version 1.9.3 and below. Older versions of ClickHouse required a Date column as a filter, so the extra column was required. ClickHouse Grafana plugin 1.9.4 and above do not require it. You can just skip this column once Version 1.9.4 is released.
Time shift. Most production data sets generate up-to-the-minute data, but we are using a static data set that cuts off after 2017. To use Grafana’s handy ‘Last <time range>’ drop down to select data, we can specify a time shift of “29M” or 29 months. Grafana adds this to the data which means the older data series will now behave as if it is current. (Select another value if you use a dataset with a different cutoff.)
After setting these values you still will not see data in the panel, because we have not entered a query. Press the ‘Go to Query’ button and enter a query in the query window. Adjust the ‘Last <time range>’ drop down at the top of the screen to a longer time range than 6 hours and you should see something like the following.
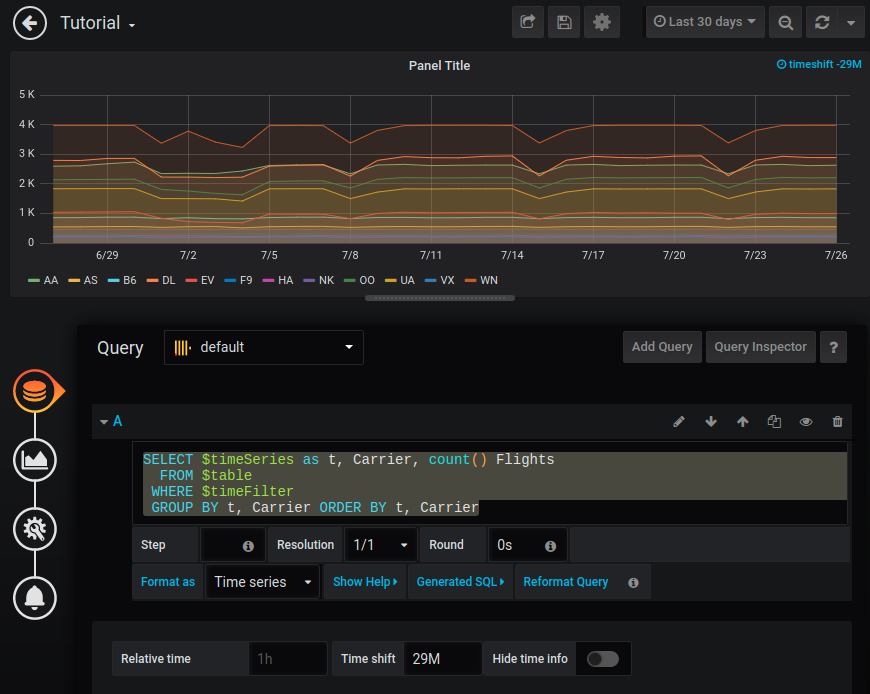
Grafana allows queries to have variables that fill in automatically when the ClickHouse plugin generates SQL. Here’s what each one means in the foregoing example.
$timeSeries — The DateTime column we specified plus some transformation logic to ensure the data is in a form that Grafana can use in displays.
$table — The base table name including the enclosing database.
$timeFilter — Automatically generated time series filter conditions.
This is a good time to talk about how we see what’s actually in the generated query, as well as what data come back. Press the ‘Query Inspector’ button to see the query text sent to ClickHouse via the HTTP interface plus the JSON response. Here’s an example.
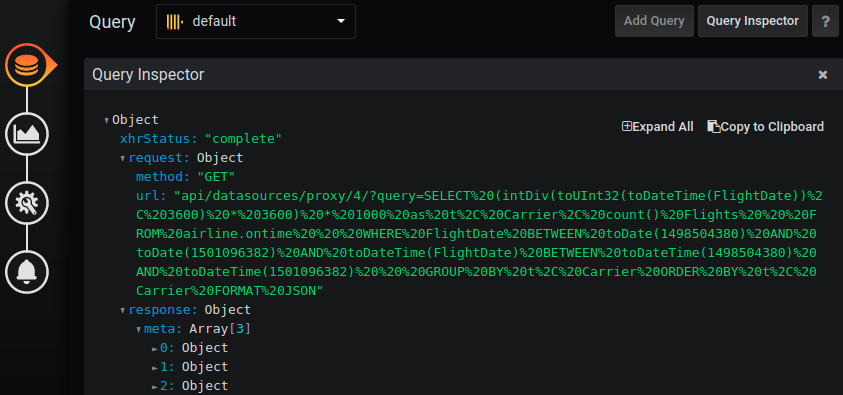
The query is URL-encoded which makes it tricky to read. You can run it through a URL-decoder to see the actual text. Here’s the query text from the previous example. Careful readers will note extra filter conditions, which are generated in version 1.9.3 and previous ClickHouse plugins.
SELECT
    (intDiv(toUInt32(toDateTime(FlightDate)), 3600) * 3600) * 1000 AS t,
    Carrier,
    count() AS FlightsFROM airline.ontime
WHERE ((FlightDate >= toDate(1498504380)) AND (FlightDate <= toDate(1501096382)))
  AND ((toDateTime(FlightDate) >= toDateTime(1498504380)) AND (toDateTime(FlightDate) <= toDateTime(1501096382)))
GROUP BY t, Carrier
ORDER BY t ASC, Carrier ASC
FORMAT JSON
If you happen to make a typo and the query does not work, you’ll see an error message instead of JSON data in the response. Clean up the query and try again until you get the expected result.
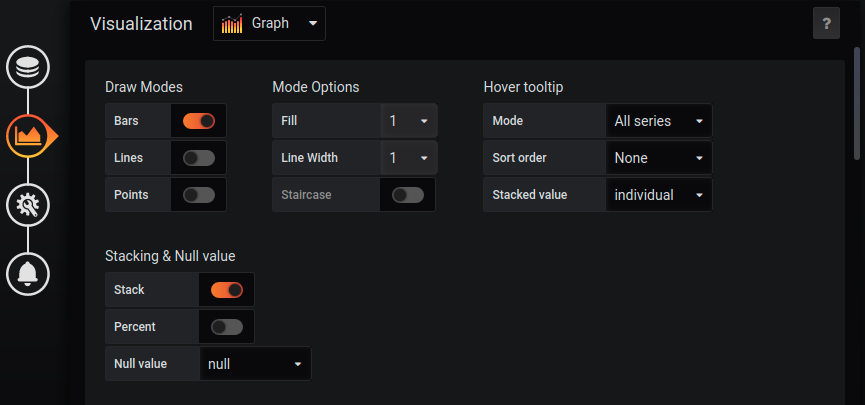
Now, let’s pick a visualization. Press the graph icon on the left and fill in the options to select a stacked bar chart, as shown in the following example. When you do this the output will shift automatically to the bar chart.
To round things off, name the panel and resize as necessary to make the dashboard with both panels look nice. At this point you should see something like the following.
You can now play around with the built-in features of Grafana that allow you to filter and zoom on data. Press one of the airline codes like ‘AA’ or select a portion of the time series. Grafana will shift the display interactively to show your selections. It quickly becomes obvious why Grafana is so popular.
Building a complete dashboard
This tutorial has shown the basics of dashboard construction, but you can do far more with Grafana and ClickHouse. There is a complete sample dashboard for airline on-time data at grafana.com which should give you additional ideas. Here’s how to load it from scratch.
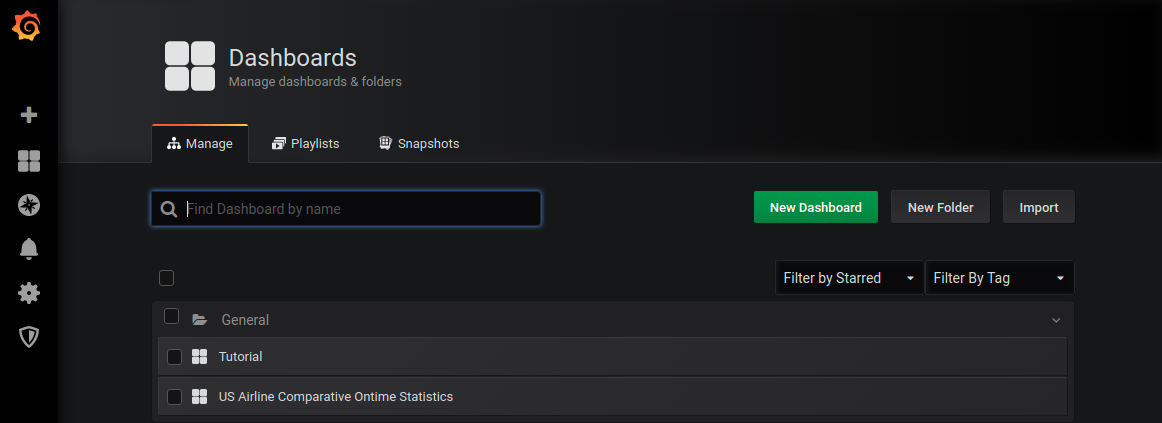
First, click on the URL in the previous paragraph. You’ll see a description of the dashboard on grafana.com. Copy the dashboard ID 11471 to the clipboard. Next, open the dashboard management screen in Grafana, which looks like the screen below.
Press the ‘Import’ button and past the dashboard ID into the Grafana.com Dashboard field. Press ‘Load’ to import. You’ll need to set the data source name–in this tutorial it’s ClickHouse–at which point you can then press Import to complete loading.
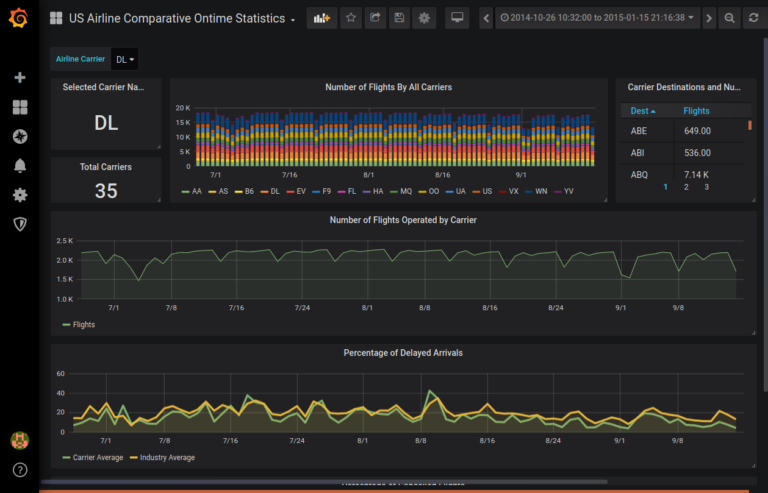
Assuming things are correctly configured in ClickHouse you will then see a view like the following.
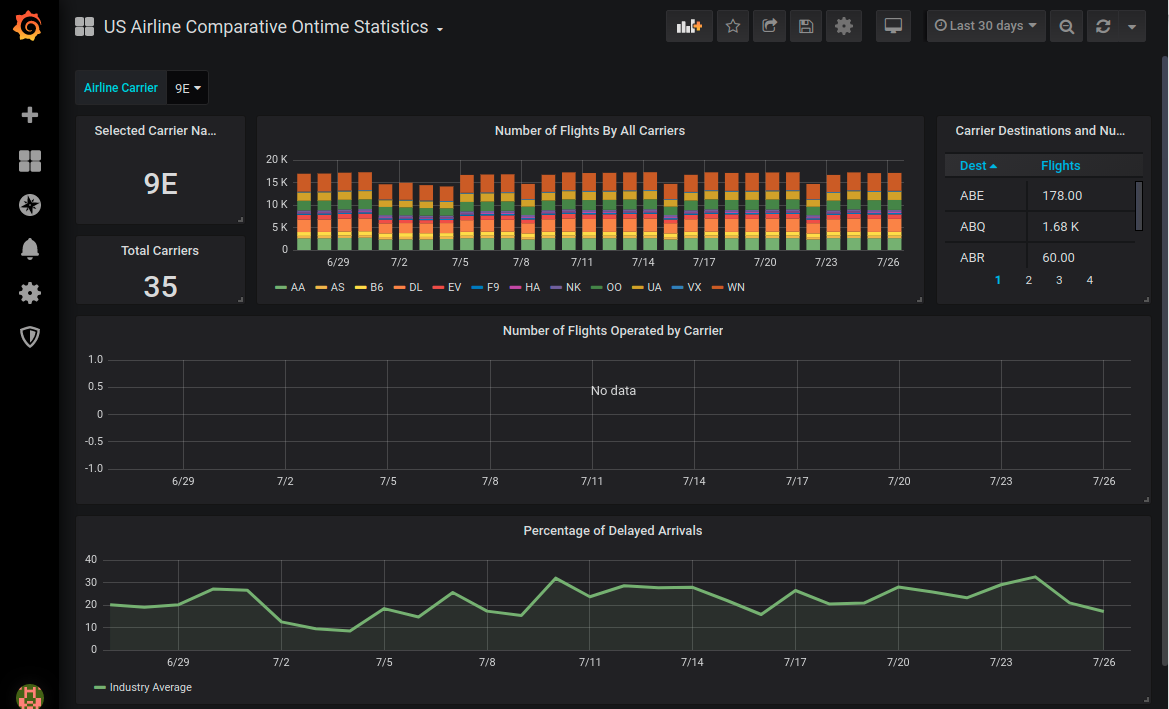
This dashboard allows you to pick an airline carrier and show specific stats for that airline. Play around with the airline carrier selection and the date range to select data. You can see how particular panels are implemented by pressing the down arrow on the panel name and editing.
The carrier selection drop down is defined by a dashboard variable. Press the dashboard tools icon and look at the variables section to see how this works.
Grafana has many features beyond even the full dashboard we just loaded. To learn more about building dashboards, check out the documentation at the Grafana Labs site.
Debugging Hints
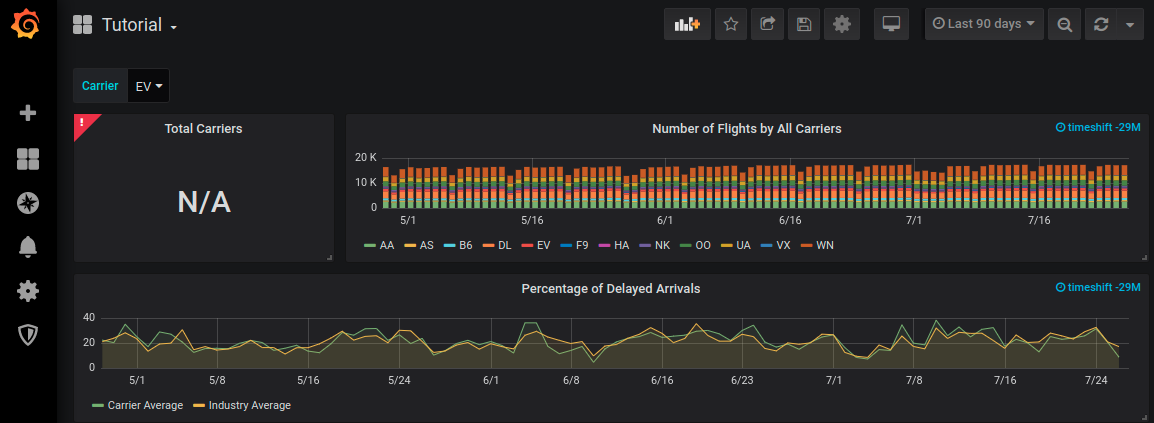
As always with powerful tools you can also make mistakes and get unexpected results. One common error is bad query syntax. For example, if we had invalid SQL in the first query panel something like the following would appear on the ‘Total Carriers’ panel. The red tag in the corner and N/A value are clues something went wrong.
Another issue is queries that do not return data, which results in an empty graph. This often occurs with time series queries, which have to be properly formatted for Grafana to display data correctly.
Here are some standard steps to try any time a query does not behave as expected.
Edit the panel and go to the Query Inspector.
If there’s an error message, you have bad SQL. Fix the problem in the query. Important note: ClickHouse plugin 1.9.3 and below generates bad SQL if you fail to specify both the DateTime and Date columns in time series queries. Make sure you have both columns correctly defined.
If you don’t see data, look at the query definition carefully.
Make sure the time series column(s) are correctly typed in the . Mixing up Date and DateTime can cause filters to fail.
Make sure any other filters are correct.
Make sure you actually have data. Decode the query and run it directly using clickhouse-client.
Grafana is overall relatively tolerant when handling results from ClickHouse. Once you get a few queries working it is easy to make more by copying SQL between panels.
Conclusion
The Altinity team maintains the ClickHouse Grafana plugin sources, building off the original implementation work from Roman Khavronenko and others. If you run into problems or have ideas for new features, please file an issue. Even better send us a PR! We love community contributions.
As with other ClickHouse-related projects we maintain, Altinity can also implement features as a commercial service. Ping us at info@altinity.com if you have something big in mind.
We’re looking forward to making more plugin improvements in the future. ClickHouse and Grafana work well together to build beautiful interactive displays. We hope this tutorial opens up some new possibilities for your applications.
P.s., I would like to thank Andrey Monachov of the Altinity team for helping to support Grafana better, especially handling the upgrade to Grafana 6.
ClickHouse® is a registered trademark of ClickHouse, Inc.; Altinity is not affiliated with or associated with ClickHouse, Inc.
There’s an error in the plugin installation instructions: sudo grafana-cli plugins install vertamedia-clickhouse-datasourcesudo systemctl restart grafana-server.serviceshould be: sudo grafana-cli plugins install vertamedia-clickhouse-datasource sudo systemctl restart grafana-server.service
Thank you! It’s fixed. (Root cause was a page formatting issue–don’t get me started. 🙂