Massive Parallel Log Processing with ClickHouse®

In this blog, I’ll look at how to use ClickHouse for parallel log processing.
Introduction
Percona is seen primarily for our expertise in MySQL and MongoDB (at this time), but neither is quite suitable to perform heavy analytical workloads. There is a need to analyze data sets, and a very popular task is crunching log files. Below I’ll show how ClickHouse can be used to efficiently perform this task. ClickHouse is attractive because it has multi-core parallel query processing, and it can even execute a single query using multiple CPUs in the background.
I am going to check how ClickHouse utilizes multiple CPU cores and threads. I will use a server with two sockets, equipped with “Intel(R) Xeon(R) CPU E5-2683 v3 @ 2.00GHz” in each. That gives a total of 28 CPU cores / 56 CPU threads.
To analyze workload, I’ll use an Apache log file from one of Percona’s servers. The log has 1.56 billion rows, and uncompressed it takes 274G. When inserted into ClickHouse, the table on disk takes 9G.
How do we insert the data into ClickHouse? There is a lot of scripts to transform Apache log format to CSV, which ClickHouse can accept. As for the base, I used this one:
https://gist.github.com/sepehr/fff4d777509fa7834531
and my modification you can find here:
https://github.com/vadimtk/clickhouse-misc/blob/master/apachelog-to-csv.pl
The ClickHouse table definition:
CREATE TABLE default.apachelog ( remote_host String, user String, access_date Date, access_time DateTime, timezone String, request_method String, request_uri String, status UInt32, bytes UInt32, referer String, user_agent String) ENGINE = MergeTree(access_date, remote_host, 8192)To test how ClickHouse scales on multiple CPU cores/threads, I will execute the same query by allocating from 1 to 56 CPU threads for ClickHouse processes. This can be done as:
ps -eLo cmd,tid | grep clickhouse-server | perl -pe 's/.* (d+)$/1/' | xargs -n 1 taskset -cp 0-$iwhere $i is (N CPUs-1).
We must also take into account that not all queries are equal. Some are easier to execute in parallel than others. So I will test three different queries. In the end, we can’t get around Amdahl’s Law!
The first query should be easy to execute in parallel:
select extract(request_uri,'(w+)Speedup:
| CPUs | Time, sec | Speedup to 1 CPU |
| 1 | 823.646 | 1 |
| 2 | 413.832 | 1.990291 |
| 3 | 274.548 | 3.000007 |
| 4 | 205.961 | 3.999039 |
| 5 | 164.997 | 4.991885 |
| 6 | 137.455 | 5.992114 |
| 7 | 118.079 | 6.975381 |
| 8 | 103.015 | 7.995399 |
| 9 | 92.01 | 8.951701 |
| 10 | 82.853 | 9.941052 |
| 11 | 75.334 | 10.93326 |
| 12 | 69.23 | 11.89724 |
| 13 | 63.848 | 12.90011 |
| 14 | 59.388 | 13.8689 |
| 15 | 55.433 | 14.85841 |
| 16 | 52.158 | 15.79136 |
| 17 | 49.054 | 16.7906 |
| 18 | 46.331 | 17.77743 |
| 19 | 43.985 | 18.72561 |
| 20 | 41.795 | 19.70681 |
| 21 | 39.763 | 20.71388 |
| 22 | 38.031 | 21.65723 |
| 23 | 36.347 | 22.66063 |
| 24 | 34.917 | 23.58868 |
| 25 | 33.626 | 24.49432 |
| 26 | 32.42 | 25.40549 |
| 27 | 31.21 | 26.39045 |
| 28 | 30.135 | 27.33187 |
| 29 | 29.947 | 27.50346 |
| 30 | 29.709 | 27.72379 |
| 31 | 29.283 | 28.1271 |
| 32 | 28.979 | 28.42217 |
| 33 | 28.807 | 28.59187 |
| 34 | 28.477 | 28.9232 |
| 35 | 28.146 | 29.26334 |
| 36 | 27.921 | 29.49916 |
| 37 | 27.613 | 29.8282 |
| 38 | 27.366 | 30.09742 |
| 39 | 27.06 | 30.43777 |
| 40 | 26.817 | 30.71358 |
| 41 | 26.644 | 30.913 |
| 42 | 26.394 | 31.2058 |
| 43 | 26.215 | 31.41888 |
| 44 | 25.994 | 31.686 |
| 45 | 25.762 | 31.97135 |
| 46 | 25.554 | 32.23159 |
| 47 | 25.243 | 32.62869 |
| 48 | 25.102 | 32.81197 |
| 49 | 24.946 | 33.01716 |
| 50 | 24.668 | 33.38925 |
| 51 | 24.537 | 33.56751 |
| 52 | 24.278 | 33.92561 |
| 53 | 24.035 | 34.26861 |
| 54 | 23.839 | 34.55036 |
| 55 | 23.734 | 34.70321 |
| 56 | 23.587 | 34.91949 |
It’s much more interesting to chart these results:
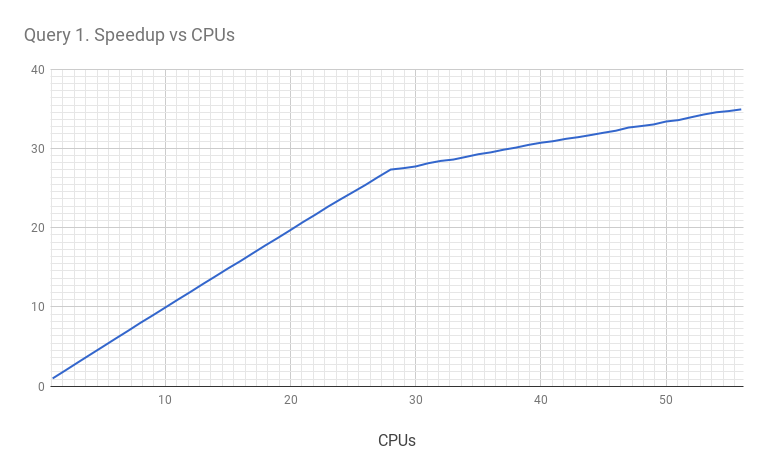
From the chart, we can see that the query scales linearly up to 28 cores. After that, it continues to scale up to 56 threads (but with a lesser slope). I think this is related to the CPU architecture (remember we have 28 physical cores and 56 CPU “threads”). Let’s look at the results again. With one available CPU, the query took 823.6 sec to execute. With all available CPUs, it took 23.6 sec. So the total speedup is 34.9 times.
But let’s consider a query that allows a lesser degree of parallelism. For example, this one:
select access_date c2, count(distinct request_uri) cnt from apachelog group by c2 order by c2 limit 300This query uses aggregation that counts unique URIs, which I am sure limits the counting process to a single shared structure. So some part of the execution is limited to a single process. I won’t show the full results for all 1 to 56 CPUs, but for one CPU the execution time is 177.715 sec, and for 56 CPUs the execution time is 11.564 sec. The total speedup is 15.4 times.
The speedup chart looks like this:
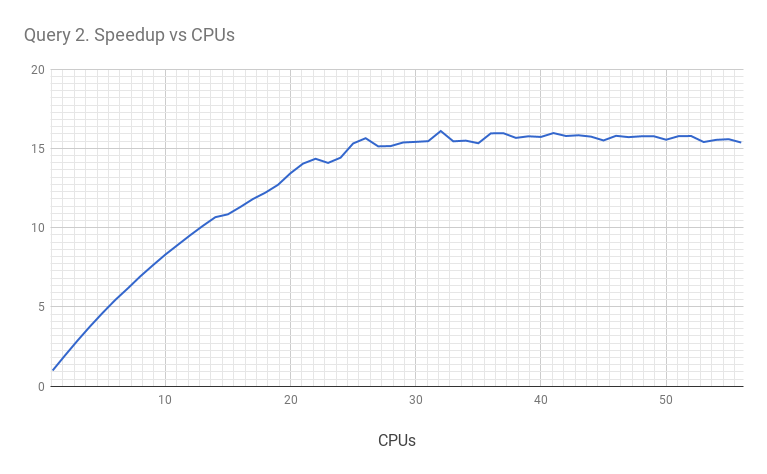
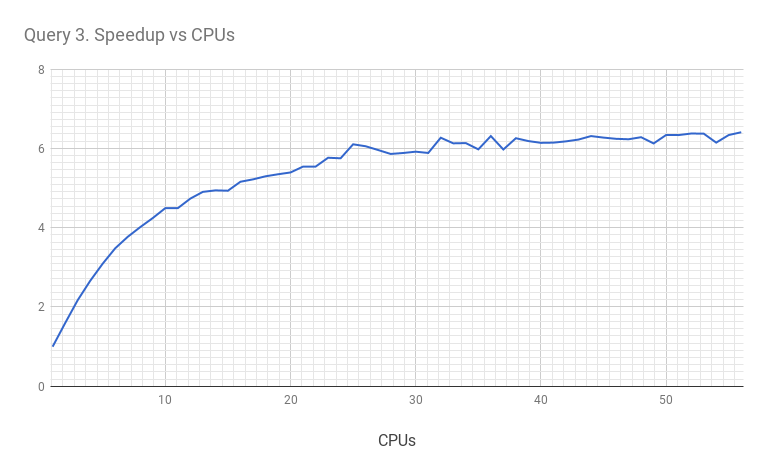
As we suspected, this query allows less parallelism. What about even heavier queries? Let’s consider this one:
SELECT y, request_uri, cnt FROM (SELECT access_date y, request_uri, count(*) AS cnt FROM apachelog GROUP BY y, request_uri ORDER BY y ASC ) ORDER BY y,cnt DESC LIMIT 1 BY yIn that query, we build a derived table (to resolve the subquery) and I expect it will limit the parallelism even further. And it does: with one CPU the query takes 183.063 sec to execute. With 56 CPUs it takes 28.572 sec. So the speedup is only 6.4 times.
The chart is:
Conclusions
ClickHouse can capably utilize multiple CPU cores available on the server, and query execution is not limited by a single CPU (like in MySQL). The degree of parallelism is defined by the complexity of the query, and in the best case scenario, we see linear scalability with the number of CPU cores. For the scaling on multiple servers you can see my previous post: https://altinity.com/blog/2017/6/16/clickhouse-in-a-general-analytical-workload-based-on-star-schema-benchmark
However, if query execution is serial, it limits the speedup (as described in Amdahl’s Law).
One example is a 1.5 billion record Apache log, and we can see that ClickHouse can execute complex analytical queries within tens of seconds.Cross-posted from Percona Database Performance Blog
ClickHouse® is a registered trademark of ClickHouse, Inc.; Altinity is not affiliated with or associated with ClickHouse, Inc.