ClickHouse® and R language

Recently Institute for Interactive Marketing and Social Media research team released ClickHouse library for R language. R is a popular language and environment for statistical analysis and visualization. It is a favorite tool for many data scientists, business analysts, and data mining specialists. Unlike Tabix and Grafana that are commonly used to visualize ClickHouse data, R is a real feature-rich programming language with its own environment, IDE (R studio), a lot of libraries and so on. R also has a wide range of extensions and integrations that allow to visualize data in a variety of forms.
R can access databases via ODBC API, but now it can be used with ClickHouse directly. The code and getting started instructions can be found at RClickhouse project homepage. Let’s try it out!
Installation
First, you need to start R and install RCLickhouse package from the CRAN (main R libraries repository):
> install.packages("RClickhouse")It may take some time to download and build the dependencies. We have tested that it works at CentOS 7 and MacOS.
Once all dependent packages are installed, two libraries need to be loaded:
> library(RClickhouse)> library(DBI)
If you use R version 3.4.2 or before, you can get a warning that RClickhouse is built with 3.4.3 version. But it works at 3.4.2 as well that is the latest stable version at the time of writing.
Usage
Once RClickhouse package is installed and libraries loaded we are ready to run some code.
Establish a connection:
> con <- DBI::dbConnect(RClickhouse::clickhouse(), host="ch01")Run query and check the data:
> e <- dbGetQuery(con, "select toStartOfHour(access_time) ts, count(*) hits from hits where access_day >= today()-1 group by ts order by ts")
head(e)
ts hits
1 2017-11-27 00:00:00 857927
2 2017-11-27 01:00:00 866180
3 2017-11-27 02:00:00 945329
4 2017-11-27 03:00:00 1087994
5 2017-11-27 04:00:00 1262263
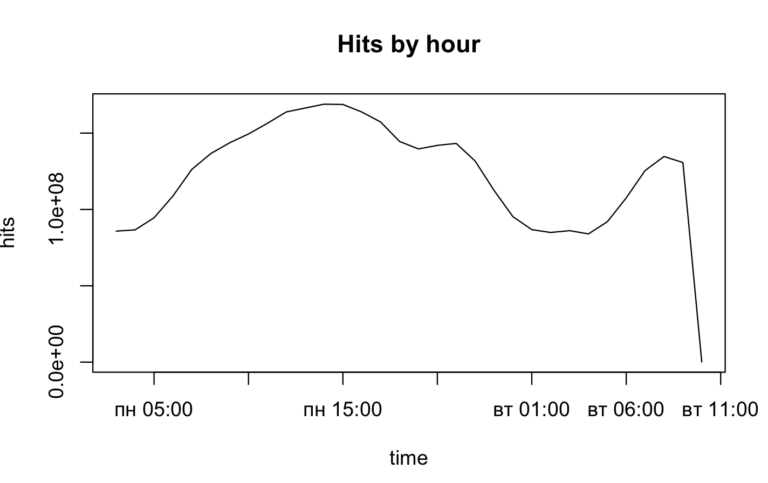
6 2017-11-27 05:00:00 1365541Draw a simple graph:
> plot(e$ts, e$hits, type="l", main="Hits by hour", xlab="time", ylab="hits")

Conclusion
This is just a quick example which shows how easily R can be used to visualize data stored in ClickHouse. Of course, R allows to do much more interesting things. This may be extremely useful if you need to do complex visualizations, run statistical models on ClickHouse data and so on.
The power of R combined with a speed of ClickHouse creates unique analytic toolset and simplifies ClickHouse adoption by analysts and data scientists. With libraries for Python, Go and R all major languages used by data analysts integrate with ClickHouse.
ClickHouse® is a registered trademark of ClickHouse, Inc.; Altinity is not affiliated with or associated with ClickHouse, Inc.
Hi.I’m trying to connect to clickhouse with RStudio in Windows 10 to a Virtual Machine with the database running on Ubuntu, and I get the following error :
> con <- DBI::dbConnect(RClickhouse::clickhouse(), host="192.168.1.4" )Error in connect(config[["host"]], strtoi(config[["port"]]), config[["db"]], : fail to connect: No error> config_paths
Can you help me?Thanks
Hi David,
Sorry, I did not notice your question. I’ve just tried it with R console on my Mac — connection works perfectly. If something is wrong with connection settings – I get meaningful ClickHouse error message. Unfortunately, there is no Windows PC in my neighbourhood to try RStudio.
Alexander
Hello
Thanks for answering
The problem was in the configuration of the virtual machine. The package works very well.I keep discovering very interesting features from this database. In our company we developed on Oracle Apex and looking for an alternative to enhance the analysis of large volumes discovered ClickHouse.I hope that this platform is spread rapidly in the West because it has enormous potential
regards