Monitoring ClickHouse on Kubernetes with Prometheus and Grafana


The ClickHouse Kubernetes operator is great at spinning up data warehouse clusters on Kubernetes. Once they are up, though, how can you see what they are actually doing? It’s time for monitoring!
In this article we’ll explore how to configure two popular tools for building monitoring systems: Prometheus and Grafana. The ClickHouse Kubernetes operator includes scripts to set these up quickly and add a basic dashboard for clusters.
Monitoring Architecture
Let’s start with a quick look at how monitoring works in a Kubernetes ClickHouse installation. Here’s a picture of the main moving parts.
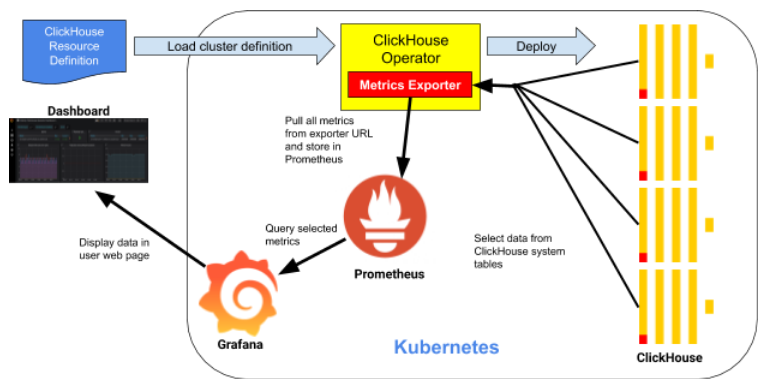
All of the key components run in Kubernetes. Starting at the top, the ClickHouse Kubernetes Operator deploys and manages ClickHouse clusters on Kubernetes.
The next component is Prometheus, a time-series database that stores metrics on all components we are observing. It fetches metrics on ClickHouse nodes from the Metrics Exporter. This operator component implements a Prometheus exporter interface. The interface exposes data in a standard format that Prometheus understands.
The final component is Grafana. It serves up dashboards to web browsers. The dashboards fetch data using queries back to the Grafana server, which in turn calls Prometheus.
The ClickHouse operator tracks cluster configurations and adjusts metrics collection without user interaction. This is a handy feature that helps reduce management complexity for the overall stack. Speaking of the stack, let’s now dive in and set it up.
Getting Started
Scripts used in this demo come from the ClickHouse Kubernetes operator project on GitHub. Your first step is to grab the current source code. You won’t need to build anything because the actual services are prebuilt container images.
git clone https://github.com/Altinity/clickhouse-operator
cd clickhouse-operator
(Note: If you have already cloned the repo, run ‘git pull’ to ensure it is up-to-date.)
All further steps will require a running Kubernetes cluster and a properly configured kubectl that can reach it. If you don’t have Kubernetes handy you can take a break and install Minikube. If you are using an existing cluster you will need system privileges to create namespaces and deploy to the kube-system namespace.
Set Up ClickHouse on Kubernetes
Users already running ClickHouse operator to run Kubernetes clusters can skip this section. If you are starting from a clean Kubernetes installation, read on.
Install ClickHouse Operator
The quickest way to install the ClickHouse operator is to apply the .yaml deployment file as shown below:
kubectl apply -f deploy/operator/clickhouse-operator-install.yaml
kubectl get all -n kube-system --selector=app=clickhouse-operator
Once the second command shows a running clickhouse-operator pod, you are ready to proceed.
Install Zookeeper
Zookeeper is necessary for ClickHouse replication to work. You can quickly install it as follows: use the second command to check that zookeeper pods are running (this example just uses one).
deploy/zookeeper/quick-start-persistent-volume/zookeeper-1-node-create.sh
kubectl get all -n zoo1ns
Create a ClickHouse Cluster
We can now start a ClickHouse cluster, which will give us something to look at when monitoring is running. For this example we will install a cluster with 2 shards and 2 replicas each. Here’s the command to start the cluster and see the pods.
kubectl apply -f docs/chi-examples/17-monitoring-cluster-01.yaml
kubectl get all
You can access ClickHouse directly by running ‘kubectl exec,’ as in the following example. kubectl exec -it chi-monitoring-demo-replcluster-0-0-0 clickhouse-clientWelcome to your cloud native data warehouse! We can now proceed with the installation of the monitoring stack.
Install Prometheus
Cd to the deploy/prometheus directory. Run the following commands to install Prometheus and check that it is running. You will see an operator for Prometheus as well as a couple of pods.
./create-prometheus.sh
kubectl get all -n prometheus
The deployment script configures the ClickHouse operator as a target source of metric data. You can confirm Prometheus sees the operator using a curl command + jq to fetch active targets. The following commands expose the Prometheus listener port and do exactly that.
kubectl -n prometheus port-forward service/prometheus 9090 &
curl -G http://localhost:9090/api/v1/targets?state=active | jq '.data.activeTargets[].labels'
Rather than using curl, you can also open the following URL in a browser to see the same information: http://localhost:9090/targets. Don’t forget to run the port-forward command.
Install Grafana
Grafana is the last component. Cd to the deploy/grafana/grafana-with-grafana-operator directory. Use the following commands to install Grafana and check that it is running. Like Prometheus, you will see an operator and a Grafana pod after successful installation.
./install-grafana-operator.sh
./install-grafana-with-operator.sh
kubectl get all -n grafana
The export command at the beginning causes the operator to load the ClickHouse plugin. This is not strictly necessary for our demo, but it allows you to create ClickHouse data sources and load dashboards of your own that talk directly to ClickHouse servers. To make dashboards visible, expose the Grafana port as follows:
kubectl --namespace=grafana port-forward service/grafana-service 3000The Grafana server user and password are admin/admin. You will want to change this before making Grafana publicly accessible.
Using the Default Dashboard
The Grafana installation script automatically installs a Prometheus-based dashboard for monitoring ClickHouse. This is a nice touch, since it means we can now see ClickHouse metrics without any special effort.
Next, point your browser to the following URL: http://localhost:3000. You’ll see a dashboard like this:
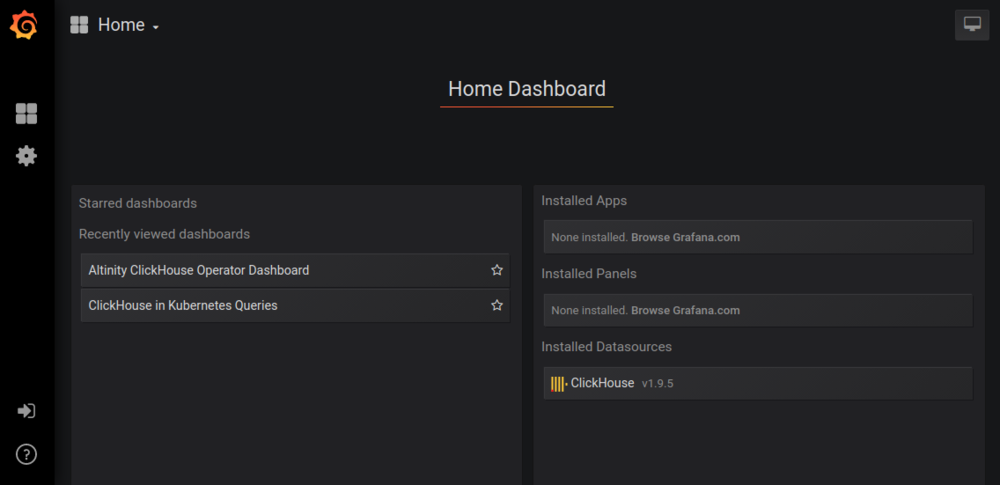
Press the Altinity ClickHouse Operator Dashboard link and you will be rewarded by something like the following:
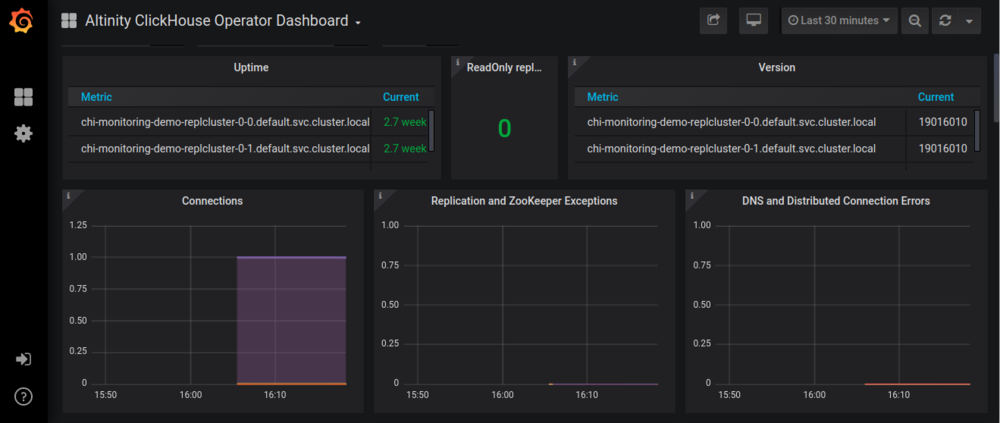
If you are already familiar with Grafana, you will find the default dashboard easy to understand. If you are a new Grafana user, on the other hand, here are a few things to try:
-
Select different values on the time drop-down on the upper right to see metrics at different time scales.
-
Use the selectors at the top of the screen to zero in on data for specific Kubernetes namespaces, ClickHouse installations, and specific servers.
-
Click the name of any panel and select View to look at individual metrics in detail.
Another fun exercise is to use the ClickHouse operator to add a new cluster or scale an existing cluster up or down. Changes to metrics take a few minutes to percolate through Prometheus. Press the refresh button (or reload the screen) to see the changes appear both in panels as well as the selector drop down at the top of the screen.
Where to go next
As noted above, this blog post is the beginning of ClickHouse monitoring, not the end. Here are a few things you can do.
Put some load on the system
Monitoring idle systems is dull. You can put load on the system as follows. First, connect to one of the pods.
kubectl exec -it chi-monitoring-demo-replcluster-0-0-0 bashNext, create a source table on all nodes on the cluster and a distributed table over it.
clickhouse-client
ClickHouse client version 19.16.10.44 (official build).
. . .
:) CREATE TABLE IF NOT EXISTS sdata2 ON CLUSTER '{cluster}' (
    DevId Int32,
    Type String,
    MDate Date,
    MDatetime DateTime,
    Value Float64
) Engine=ReplicatedMergeTree('/clickhouse/{cluster}/tables/{shard}/sense/sdata2', '{replica}', MDate, (DevId, MDatetime), 8129);
:) CREATE TABLE IF NOT EXISTS sdata_dist ON CLUSTER '{cluster}'
AS sdata
ENGINE = Distributed('{cluster}', default, sdata, DevId);Finally, put some load on the system by connecting to any ClickHouse pod and executing a clickhouse-benchmark command like the following:
clickhouse-benchmark <<END
SELECT * FROM system.numbers LIMIT 10000000
SELECT 1
SELECT count() Count, Type, MDatetime FROM sdata_dist GROUP BY Type, MDatetime ORDER BY Count DESC, Type, MDatetime LIMIT 5
INSERT INTO sdata_dist SELECT number % 15, 1, toDate(DateTime), now() + number as DateTime, rand() FROM system.numbers LIMIT 5000
END
Check out the clickhouse-benchmark documentation for more information. Enhance the dashboard
You can login to Grafana with user “admin” and password “admin.” At this point you can edit the dashboard to add new features or move things around.
Build your own monitoring dashboards
The default dashboard is a good starting point that shows examples of different types of Prometheus queries to access exported ClickHouse data. Make a copy and add your own metrics. The dashboard JSON source is located in clickhouse-operator/deploy/grafana/grafana-with-grafana-operator. You can also export the JSON definition directly from the Grafana server.
Build dashboards that access ClickHouse
We’ll cover this topic in greater detail in a future blog article, but here are a few tips to building dashboards that access ClickHouse directly.
Step 1: Create a user with network access enabled from other namespaces. You’ll need to add a section to your ClickHouse cluster resource file that looks like the following:
users:
  # User for grafana
  grafana/password: secret
  grafana/networks/ip: "::/0"
Step 2: Ensure that your Grafana service has the ClickHouse plugin loaded. The installation procedure described above does this automatically as part of installation. (Just in case you have forgotten the user/password for the server, it’s admin/admin.)
Step 3: Create data sources to access ClickHouse servers. If you are going through the main load balancer use a URL like http://clickhouse-simple.default.svc.cluster.local:8123. The typical DNS name pattern is cluster_name.namespace.svc.cluster.local for Minikube and kops. Other Kubernetes distributions may differ.
Conclusion
ClickHouse Operator, Grafana, and Prometheus work well together to enable monitoring of ClickHouse installations running on Kubernetes. This blog article shows how to set up the default monitoring stack in a Kubernetes installation that you fully control.
Of course, there are many other types of monitoring, monitoring tools, and environments to monitor. We are planning more articles to address them, so stay tuned. In the meantime, check out our recent ClickHouse Monitoring 101 webinar for a soup-to-nuts overview.
If you need help on monitoring, please contact Altinity. We’re happy to provide commercial support. Finally, if you find anything wrong with the scripts described here, log an issue on the ClickHouse operator project in GitHub. Even better, fix it yourself and file a PR. We love improvements from the open source community!
Thx for this article guys.
For those who don’t want to keep things locally there is a solution, https://sematext.com/blog/clickhouse-monitoring-key-metrics/
free trial is 30d which is more than enough.