---
url: 'https://altinity.com/blog/2018-4-20-clickhouse-monitoring-with-graphite'
title: 'ClickHouse® Monitoring with Graphite'
author:
name: Vladislav Klimenko
url: 'https://altinity.com/author/vladkaltinity/'
date: '2018-04-20T17:20:49-07:00'
modified: '2018-04-20T17:20:49-07:00'
type: post
summary: 'Monitoring is an important part of operating any software in production. The proper monitoring solution needs to store metrics somewhere as well as provide visualization capabilities. ClickHouse does not have such a tool packaged, but there are several 3rd-party monitoring...'
categories:
- Blog
tags:
- ClickHouse
- Graphite
- Monitoring
image: 'https://altinity.com/wp-content/uploads/2020/02/517e9-graphite_web_cr.png'
published: true
---
# ClickHouse® Monitoring with Graphite
## Introduction
Monitoring is an important part of operating any software in production. ClickHouse is not an exception here. ClickHouse provides an introspection to various system metrics using tables in ‘system’ schema but they only show current or cumulative numbers. It is sufficient in order to understand what’s going on with the system right now, but can not show time trends or what has been happening a minute ago. The proper monitoring solution needs to store metrics somewhere as well as provide visualization capabilities. ClickHouse does not have such a tool packaged, but there are several 3rd-party monitoring solutions that can be used. [Graphite](https://graphiteapp.org/) is one of the popular options, and it can be natively integrated with ClickHouse. In this article, we will describe how to configure Graphite for monitoring ClickHouse metrics.
## Install Graphite
Graphite installation is [described in details in its manual](http://graphite.readthedocs.io/en/latest/install.html)
Feel free to choose any type of installation.
## Setup ClickHouse – Graphite integration
ClickHouse configuration for Graphite is specified in ClickHouse config file. Edit main config file `/etc/clickhouse-server/config.xml` or add a separate `/etc/clickhouse-server/conf.d/graphite.xml`, and append following section:
```
192.168.74.150
2003
0.1
60
one_min_cr_plain
true
true
true
192.168.74.150
2003
0.1
1
one_sec_cr_plain
true
true
false
```
Settings description:
- `host` – host where Graphite is running.
- `port` – Carbon plain text receiver port (2003 is default in Graphite). In general, Graphite has multiple ports open, with the following default values:
`80` nginx
- `2003` carbon receiver – plaintext **this one should receive data from ClickHouse**
- `2004` carbon receiver – pickle
- `2023` carbon aggregator – plaintext
- `2024` carbon aggregator – pickle
- `8080` Graphite internal gunicorn port (without Nginx proxying).
- `8125` statsd
- `8126` statsd admin
- `interval` – interval for sending data from ClickHouse, in seconds.
- `timeout` – timeout for sending data, in seconds.
- `root_path` – prefix used by Graphite.
- `metrics` – should data from `system_tables-system.metrics` table be sent.
- `events` – should data from `system_tables-system.events` table be sent.
- `asynchronous_metrics` – should data from `system_tables-system.asynchronous_metrics` table be sent.
Multiple `` sections can be used for sending different data at different intervals.
**NOTE,** ClickHouse restart is required in order to activate graphite configuration.
## Monitoring
Navigate to Graphite web monitoring tool in a browser as `http://host/dashboard` in order to see Graphite metrics.
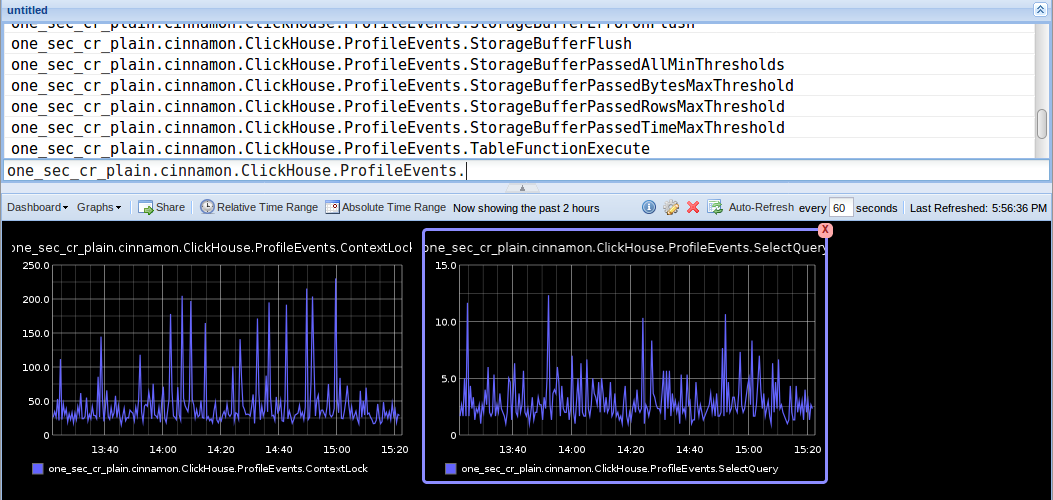
If everything is properly configured, and ClickHouse sends its data to Graphite, entries with prefixes should be displayed, as specified in ClickHouse’s configuration, e.g.:
```
one_sec_cr_plain
```
For all available metrics Graphite will display monitoring graphs.